
 Zylo Ecosystem
 Pearl
Pearl Walrus
 Derive
 Quantus
 Aerodrome Finance
 Sui
Sui

Bitcoin price showed a potential breakout setup as analysts highlighted an inverse head-and-shoulders pattern, a structure known for indicating trend reversals. This technical formation has emerged across the daily chart, sparking calls for a $150,000 target.
Bitcoin Price Technical Setup Points to Imminent Surge
Inverse Head and Shoulders is a well-known technical analysis indicator that is normally used to signal a bearish trend reversal. In the case of Bitcoin price, the trend was composed of the left shoulder (LS), head (H) and right shoulder (RS).
These stages are followed by a breakout above the neckline, which is seen as a confirmation of upward momentum.
Merlijn The Trader, a crypto analyst, said the formation had “doubled,” reinforcing bullish momentum. The pattern includes a left shoulder, head, and right shoulder, followed by a neckline that Bitcoin appears ready to break above.
He called the structure a “supercycle ignition setup,” suggesting the next bullish leg could push BTC to new all-time highs.
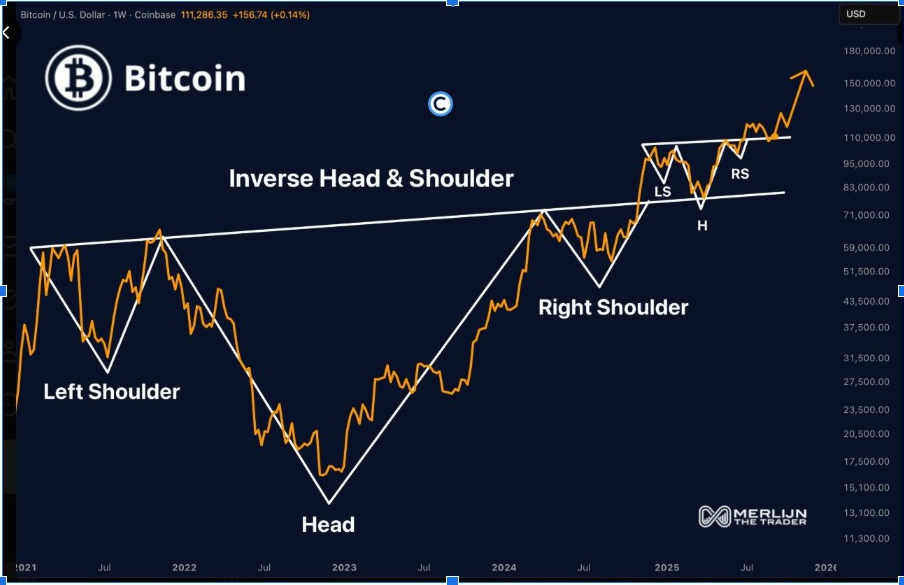
Merlijn The Trader observed that this pattern is not only a common bullish pattern, but also a possible supercycle ignition.
Based on the analysis, the next leg up in Bitcoin price will aim at $150,000. This forecast is highly supported by the inverse head-and-shoulders pattern, which indicated a breakout that might take Bitcoin to new all-time highs.
Growing Optimism in BTC Price Movement
Meanwhile, Bitcoin has seen a resurgence in market momentum, with both retail and institutional investors taking notice of its performance in recent months. The leading crypto is assuming a familiar trend as played out in the 2017 and 2025 Bitcoin price cycles.
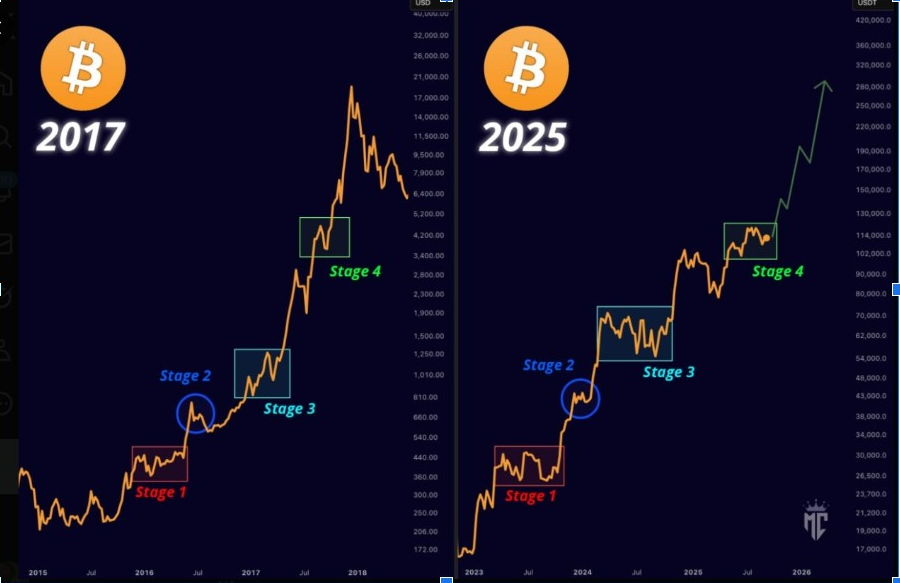
Similar to the 2017 cycle, the chart indicated Bitcoin is now in the explosive growth phase This is after progressing through the initial stages of accumulation and gradual price increases. Stage 4 may be the last in increasing BTC price to $250,000 or higher.
Stage 1 was the low-price, accumulation stage and Stage 2 was when the market interest started to accumulate. The chart suggested that the price of Bitcoin will possibly be the same in the current year as it was in 2017, and possibly hit a new all-time high shortly.
Bitcoin Vs Traditional Assets
Bitcoin has been performing very well over the past five years, in comparison to traditional assets. An investment of 1000 dollars in BTC five years ago performed better than some of the largest traditional investments, including the Nasdaq 100, S&P 500 and Gold.
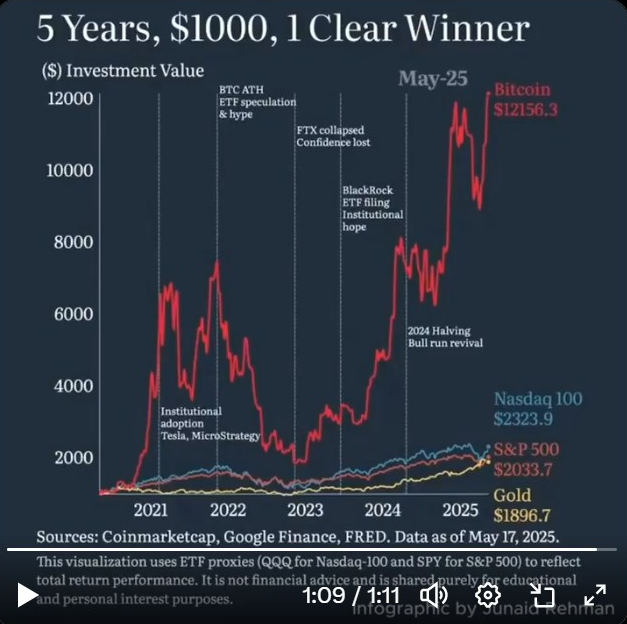
Institutional support and major incidents, like the filing of the BlackRock ETF, have contributed to his growth path. Such financial products have made Bitcoin more attractive, especially among institutional investors.
In the meantime, recent Bitcoin news reported that the U.S. Congress introduced a bill that suggested a Strategic Bitcoin Reserve, and instructed the Treasury to evaluate the feasibility. The bill required a thorough report on the issue of custody, cybersecurity, and legal authority.
Notably, the move followed President Trump’s earlier executive order in March to establish a digital asset stockpile. This combination of factors suggested that Bitcoin price momentum is accelerating in the coming months.
To further support the optimistic Bitcoin price prediction, Parabolic SAR indicator showed that it is on an uptrend as shown by the blue dots beneath the price action. The RSI is at 69 presently, bordering on overbought, and indicating BTC is approaching major breakout levels. As the two technical indicators also support the bullish trend, BTC price is likely to touch $150,000 in the next leg of its surge.



