
 Puffer
 ZKsync
 Pearl
Pearl Bitcoin
 Ondo
Ondo Walrus
 Pudgy Penguins

Bitcoin price is breaking out of multiple bullish patterns, with analysts highlighting key support zones that signal a potential strong upswing. The overall outlook for BTC remains optimistic, supported by expanding chart formations, key accumulation zones, and historical bull cycle fractals.
Bitcoin Price Bullish Megaphone Pattern Signals Breakout
According to analyst Ash Crypto, Bitcoin price formed a bullish megaphone pattern on the daily chart, a structure often associated with continuation setups that signal potential upside. This formation, characterized by higher highs and lower lows within diverging trendlines, reflected rising volatility as price widened its range.
Additionally, the formation of the pattern indicated that the asset was building up to a potential breakout, holding technical validity provided that the price remained within the widening limits.
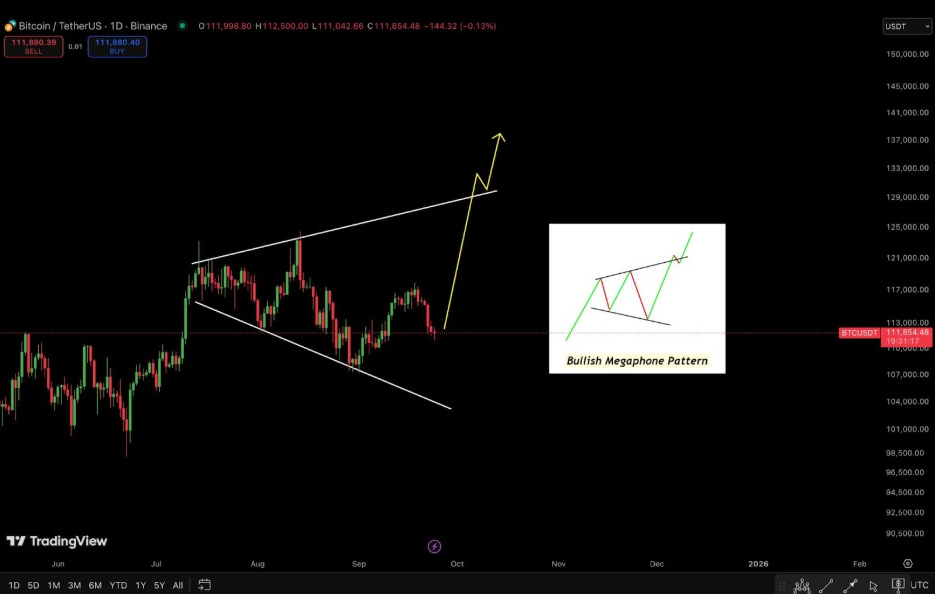
More so, the analysis observed Bitcoin price would be consolidating along the lower limit before an upward trend, surpassing the upper trendline. Such a breakout has, in the past, attracted strong bullish momentum while often marking the beginning of a new rally phase.
Meanwhile, the accompanying schematic illustrated how similar megaphone setups typically resolved in favor of buyers.
Besides, the consolidation phase was outlined as a crucial base-building phase. If Bitcoin remained above the bottom limit without a clear breakout, there were high chances of an upward breakout. The analysts expect the price to reach higher if the megaphone formation supports its bullish trend.
Buyers Defend Critical Range
At the same time, CrediBULL Crypto’s analysis showed the short-term organization of Bitcoin price, emphasizing the importance of $110,000-$113,000 support. This zone had been a strong base several times, as buyers intervened to protect the level each time the price fell to the bottom limit. In clearing off the market, the frequent sweeps created a consolidated basis for a possible reversal in a favorable direction.
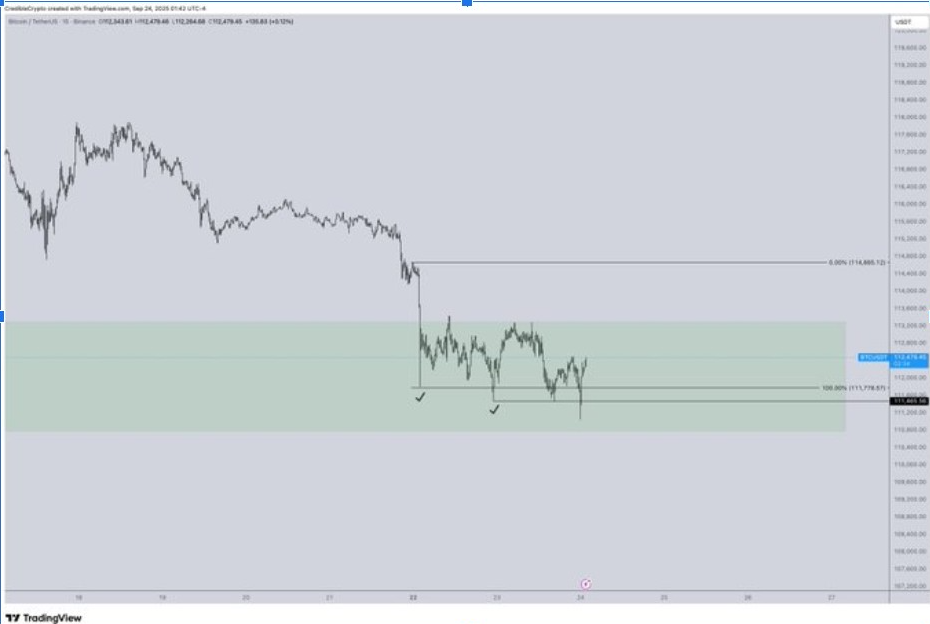
The resilience of this support zone suggested active accumulation, with price stabilizing after multiple retests. In case this range persists, analysts pointed out that the next probable target will be local highs of approximately $115,000. Recapturing that level would signal approval, indicating a renewed bullish trend with the market returning to buyers.
However, the report also warned that repeated sweeps would ultimately undermine support unless follow-through buying pressure were high enough. A long-term breach below $110,000 may cause further downside risk in Bitcoin prices.
In the meantime, however, the structure was constructive. As a progression of the positive short-term picture, traders are awaiting lower lows and a breakout through $115,000.
Market Patterns Signal Strength Behind Bitcoin’s Uptrend
On the other hand, analyst BitBull pointed out that the new price behavior of Bitcoin was very similar to the market structure of the first quarter of 2024. A five-wave corrective structure was completed in the same time frame with a downward wedge break-out, which saw price jump over $72,000.
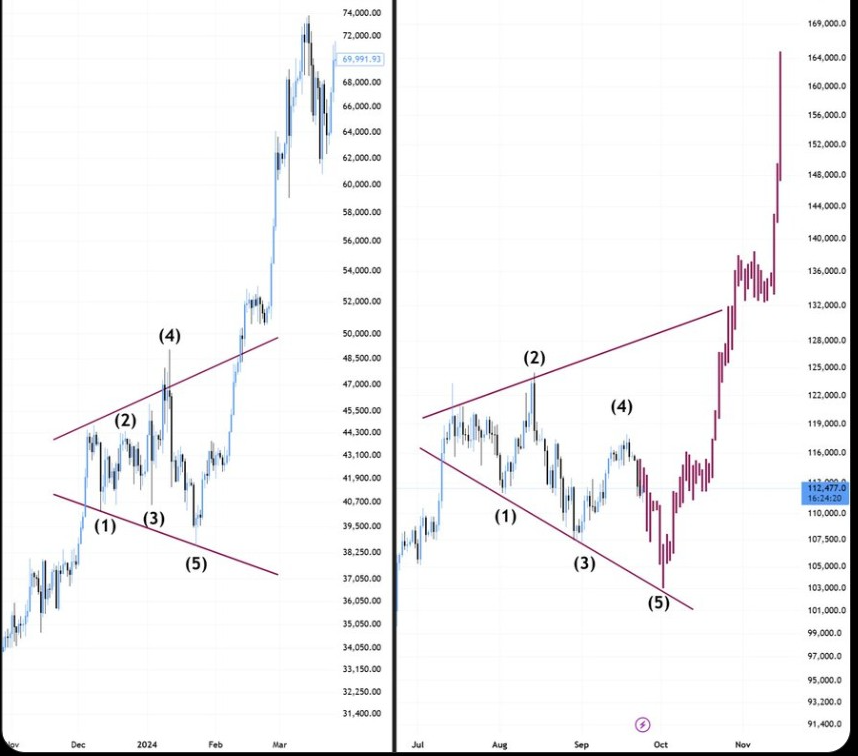
Most important to note is that the chart appeared to follow the same pattern, where Bitcoin escaped a similar wedge and surged upward, reaching almost $140,000 before stopping. This consistency highlighted that the macro bullish trend was persistent, which meant the market structure was healthy.
BitBull further noted that a healthy pullback to the $103,000-$105,000 zone should be expected to re-establish major indicators and clear over-leveraged positions. Retaining this support range would affirm underlying demand and precondition a new leg possibly above past peaks.
Although volatility may occur in the short term, the overall mood is bullish, with institutional underlying demand and repetitive structural trends.


