
 Zylo Ecosystem
 Pearl
Pearl Walrus
 Derive
 Quantus
 Aerodrome Finance
 Sui
Sui

Bitcoin price tested $ 120,000 after whales moved $4.16 billion and BlackRock purchased $899 million in BTC. Analysts now eye $117,000–$120,000 as the key rebound zone.
Dormant $4.16B Bitcoin BTC Awakens as Price Tests $120K Support
Bitcoin (BTC) traded near $122,700 on October 8 as traders weighed the massive movement of whales and institutional inflows. Data showed $4.16 billion worth of dormant Bitcoin had just moved the largest transfer from long-inactive wallets this year, according to Coin Bureau.
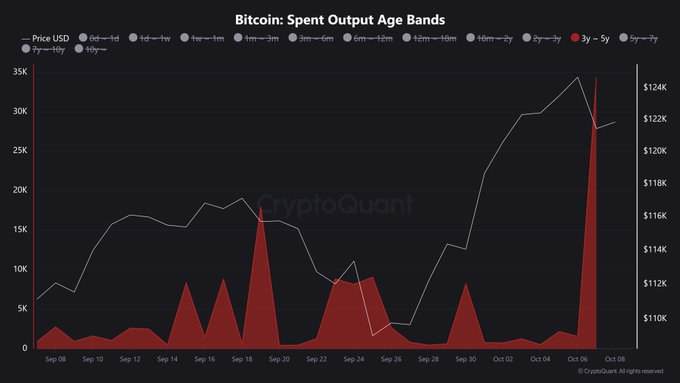
The move coincided with a volatile week for BTC. The price faced sharp rejection near $125,000 before rebounding from a key support zone. Analysts viewed the sudden whale activity and fresh institutional buying as early signals of a potential reversal phase.
BlackRock’s $899M BTC Purchase Reignites Institutional Debate
Whale Insider reported that BlackRock purchased approximately $899.4 million worth of Bitcoin, fueling fresh discussions about Wall Street’s trend of accumulating Bitcoin. The timing of the purchase raised eyebrows as BTC approached the critical $120,000 area.
Institutional demand has historically acted as a catalyst for market confidence. The world’s largest asset manager’s continued exposure to Bitcoin reinforced that trend.
However, analysts warned against reading it as a purely bullish signal. “Large traders demonstrated expert timing as BTC reversed from recent highs,” Glassnode posted on Oct. 8, citing profit-taking among leveraged long holders. The firm’s data revealed a “shift to a net short bias,” suggesting that many traders locked in gains and reopened short positions.
Bulls Defend $120K Support Amid Profit-Taking Pressure
Trader Ted (@TedPillows) noted that Bitcoin faced a “sharp rejection” from the $125,000 resistance but was now “approaching the $120,000 support zone.” He added that if BTC holds this level, a reversal could begin soon.
“In case Bitcoin loses this level, the next support lies around $117,000–$118,000,” he explained.
That zone has become a focal point for traders assessing market direction. Crypto Tony echoed this sentiment, stating he expected “a dip down to $117,300 overall,” while holding his long position from $109,500.
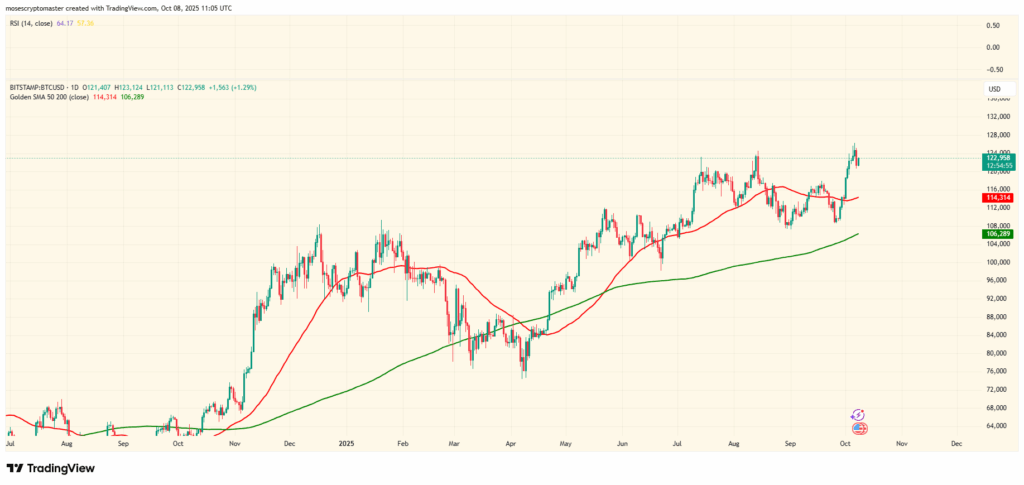
On TradingView, the BTC/USD chart showed Bitcoin trading at $122,793 at the time of press, up 1.15% on the day. The pair remained within an ascending parallel channel formed since April. The 50-day simple moving average (SMA) sat at $114,311, while the 200-day SMA remained around $106,289, both key dynamic supports that have historically defined BTC’s midterm trend.
Oversold Signals Suggest Reaccumulation Phase Beginning
Analyst Mister Crypto observed that Bitcoin appeared “oversold” on short-term indicators, suggesting that the asset was “starting the expansion phase.” His chart highlighted cyclical structures where oversold RSI readings preceded sharp recoveries.
He labelled the current phase as a transition from “shakeout” to “expansion,” hinting that recent volatility could represent an accumulation opportunity rather than a long-term top.
That view was reinforced by Crypto Seth, who said the pullback was “expected” after Bitcoin’s latest breakout attempt. He referenced his previous forecast that Bitcoin would “overshoot the last all-time high” before pulling back and starting a new wave upward.
Whale and Derivatives Data Paint Mixed Outlook
Glassnode’s long/short bias chart showed traders shifting toward a net short position of more than 4,100 BTC, aligning with profit-taking behaviour.
This positioning has historically occurred near local market tops, although it can also precede short squeezes when price rebounds faster than expected. The data underlined the delicate balance between bullish conviction and leveraged risk.
Meanwhile, the transfer of $4.16 billion in dormant Bitcoin, from wallets that had been inactive for three to five years, fueled speculation about long-term holders moving coins into circulation. While the motives remain unclear, such whale transfers often precede periods of heightened volatility.
Analysts Remain Divided as BTC Consolidates
Bitcoin’s ability to hold above $120,000 could determine its next major move. A daily close below this level could invite a broader correction toward $114,000 or even the 200-day SMA, near $106,000.
Still, momentum indicators such as the Relative Strength Index (RSI) at 63.8 suggested that BTC remained in neutral territory, neither overbought nor oversold.
As Crypto Tony, traders are watching the $117,000–$120,000 zone as the “make-or-break” level for the next leg up. Mister Crypto and Ted both agreed that holding this zone could “kickstart the expansion phase,” marking the return of bullish momentum.
Bitcoin at Crossroads as Whales Stir
Bitcoin’s latest rejection near $125,000 has not entirely shaken market conviction. With institutional giants like BlackRock buying and long-dormant wallets reawakening, attention has shifted back to whales and their timing.
As one analyst posted, “If $120K holds, BTC’s next chapter could surprise everyone again.”
At the moment, Bitcoin’s price action sits on the edge of critical support, where every candle counts.



