Zylo Ecosystem
 Pearl
Pearl Walrus
 Derive
 Quantus
 Aerodrome Finance
 Sui
Sui

Altcoins have remained stable throughout the week. The Crypto Total Market Cap, excluding Bitcoin and Ethereum, is holding around $1.08 Trillion. This could signal the start of an upcoming altcoin season. This is just below the critical 1.13-1.15 trillion resistance range.
Analysts observe that the market is drifting toward the breakout zone. Since August, an upward wedge pattern has been developing. This formation suggests a phase of tightening volatility.
The recent arrangement depicts the presence of increased lows, which are made against flat resistance. This means that the surface has a building of bullish pressure for another Altcoin season breakout.
Crypto Market Cap Points to Coming Altcoin Season
Charts indicate a definite Breakout Point at approximately $1.15 Trillion. The zone is topped by a projected expansion zone of up to $1.35-$1.45 Trillion. This could be a macro continuation of the altcoin capitalization if the resistance is broken on a weekly close.
Crypto prices are currently trading in a narrow range. Support sits at $1.06 Trillion, while resistance is near $1.15 Trillion. The current trend in the crypto market cap can be traced back to the basis structure of late 2025.
The index was in a broad range of consolidation between March and June, with a range of $800 Billion to $950 Billion. There was a rise in momentum in late June, which saw capitalization exceed 1 trillion in July.
By September, altcoins had stalled at $1.15 Trillion, with the weekly candles exhibiting recurring upper wicks, indicating market hesitation.
Although the rejection happened, buyers held firm on higher lows through September and early October. This steady support has further tightened the wedge, hinting at a potential altcoin season.
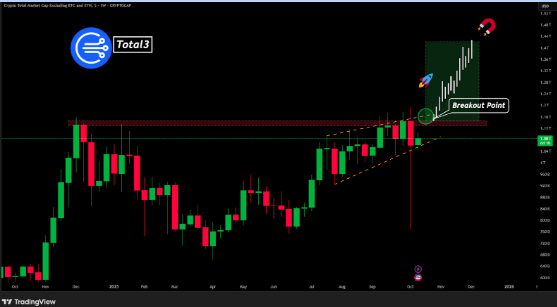
This is an equilibrium that puts the market at a critical point. The range between $1.13 Trillion and $1.15 trillion is the primary limit to a possible macro breakout. Additionally, the range of $1.06-$1.08 Trillion is a crucial base for accumulation.
Should the structure give way, the lower shelf is at approximately $1 Trillion. This was the previous breakout level from July, which serves as a safety net.
In early 2021, the altcoin index formed a falling channel across the broader market. A fake bear trap soon triggered a sharp upward surge in altcoin prices.
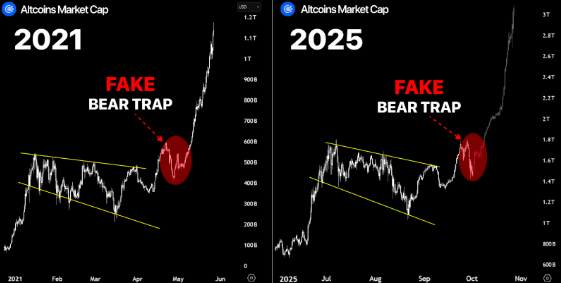
This earlier structure is reflected in the current structure visible in 2025. The 2025 chart shows a negative channel forming between July and September. A recovery in October followed, leading analysts to label it another fake bear trap.
Both red-circled areas in the charts show short-term market corrections. These dips came just before sharp vertical expansions in market capitalization.
The 2021 analog reveals a breakout following a phase of forced cooling. In contrast, the 2025 chart indicates that the market remains under continued pressure.
In both cycles, prices initially moved downward, creating pressure before experiencing a sharp upward surge. This momentum helped drive altcoin valuations higher, signaling the start of an altcoin season.
Altcoin Season Index Shows Cooling Then Rebuild
The current index of the BlockchainCenter Altcoin Season is approximately 43. This falls within the middle range between the Bitcoin Season (25) and the Altcoin Season (75).
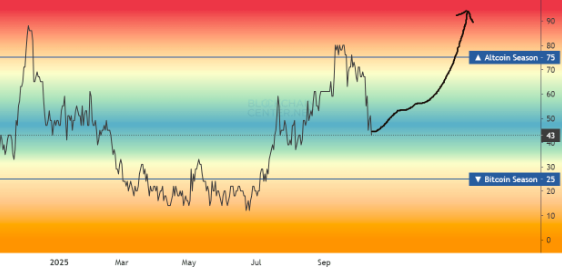
The index soared above 75 in September earlier in the year, a sign of altcoin season. Then, it sharply dropped in early October. The gradual rebound from the 40s signals a return to balance. It reflects renewed equilibrium between Bitcoin-driven trades and altcoin activity.