Bitcoin
 Aerodrome Finance
 Zerebro
 Starknet
 Zama
Zama Pearl
Pearl ZKsync

Solana price analysts have identified technical obstacles that could influence the token’s direction in the near term. Over the past few weeks, the cryptocurrency has held firm near its support level. It has struggled to break through higher resistance. This has kept many traders on the sidelines.
Market sentiment now hinges on the $200 level. This SOL price point is key for bullish momentum. A break above it could lead to a move toward $260.
Resistance Key to Solana Price Next Rally
Analyst Ali’s analysis of Solana price indicates that the token is consolidating around the support zone of $185-$190. There, buyers have consistently held off further sell-offs.
Within the 3-day timeframe, the chart indicates that the $200 level serves as the first level of resistance.
This must be reclaimed for a decisive move in the direction of the bulls. Breaking this level would confirm renewed strength in the market and could signal the beginning of an upward phase.
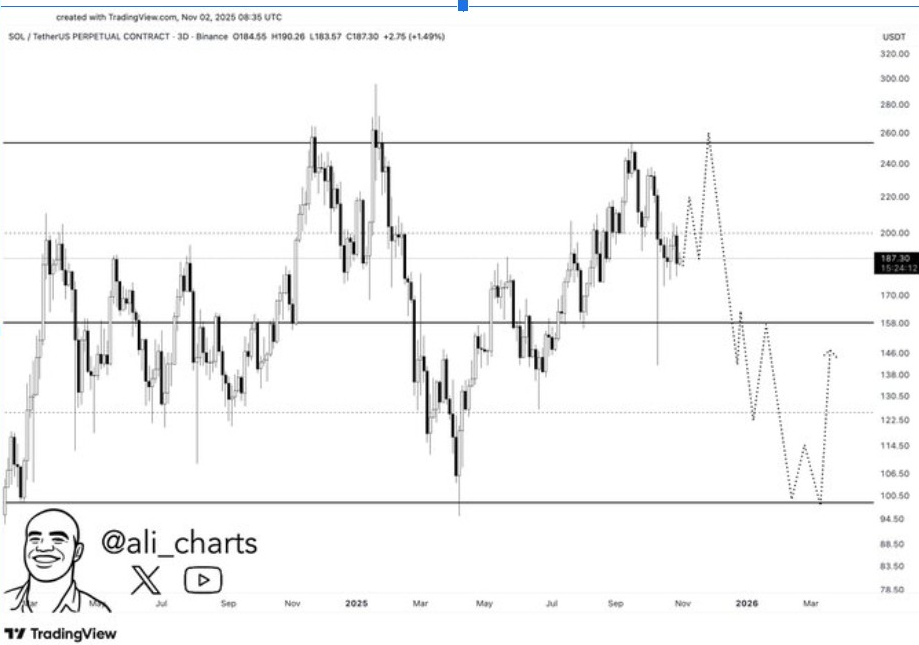
The analyst suggested that a breakout above $200 could lead to a rally to $260. It’s a level that has capped previous market cycles. The move could attract new inflows and boost the SOL price. It may also strengthen Solana’s short-term bullish outlook if trading volume rises.
In 2023 and early 2024, the Solana price showed a clear pattern. Once it reclaimed key resistance levels, strong continuation rallies often followed. However, the analyst warns that Solana failing to clear the $200 zone could confirm the bearish sentiment.
This could lead Solana to a retest of lower supports near $158, or even deeper around $130-$100. The $200 level signifies a turning point between bullish continuation and renewed bearishness.
Bearish Pressure Builds as Solana Price Tests Support
Market analysts have noted the increasing bearish pressure after the failure of the SOL price to retain the $180 support. The breakdown drove the asset to the $175 range, where both bulls and bears struggle to gain the upper hand.
Notably, the RSI stands at 31.00, approaching oversold territory, as momentum appears to be fading. The Money Flow Index (MFI) is at 16.84, indicating capital outflows and weak buying interest.
Solana price is trending within a descending channel, with resistance near $193.94. If sellers emerge and retain this level, the asset could retest lower support at $170-$168. Moreover, a break below this zone could lead to a further decline to $160, extending the correction phase.
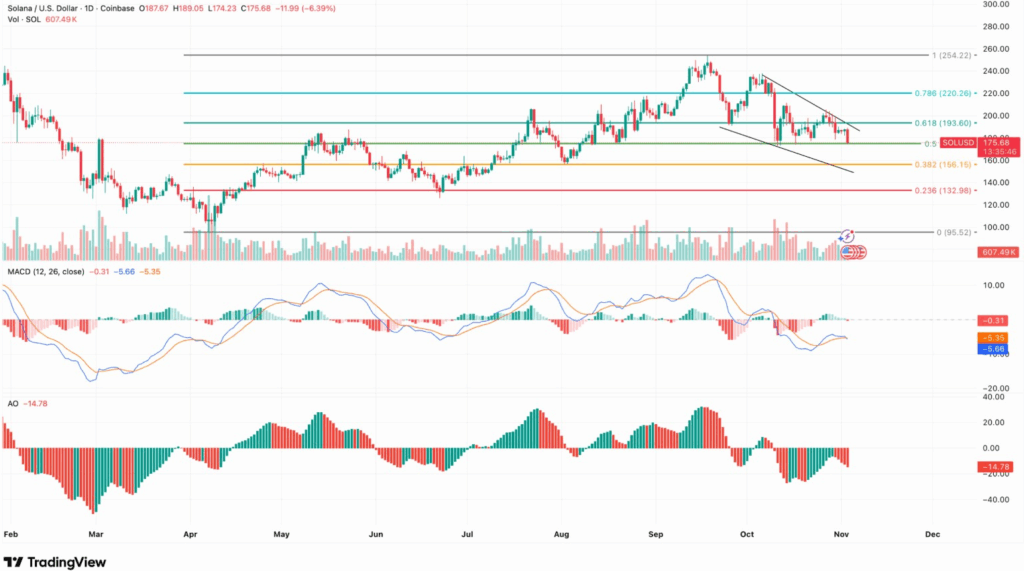
From a broader timeframe, both the MACD and the Awesome Oscillator (AO) are negative, indicating a high downside bias. Also, the 26-EMA has crossed over the 12-EMA, which favors sellers.
However, a recovery should occur if bulls can retain the 0.5 Fibonacci retracement at $175.68. The rebound could take the SOL price up towards the resistance level at $193.60. This may reduce short-term selling interest.
Inflows and Investor Confidence Shape Outlook
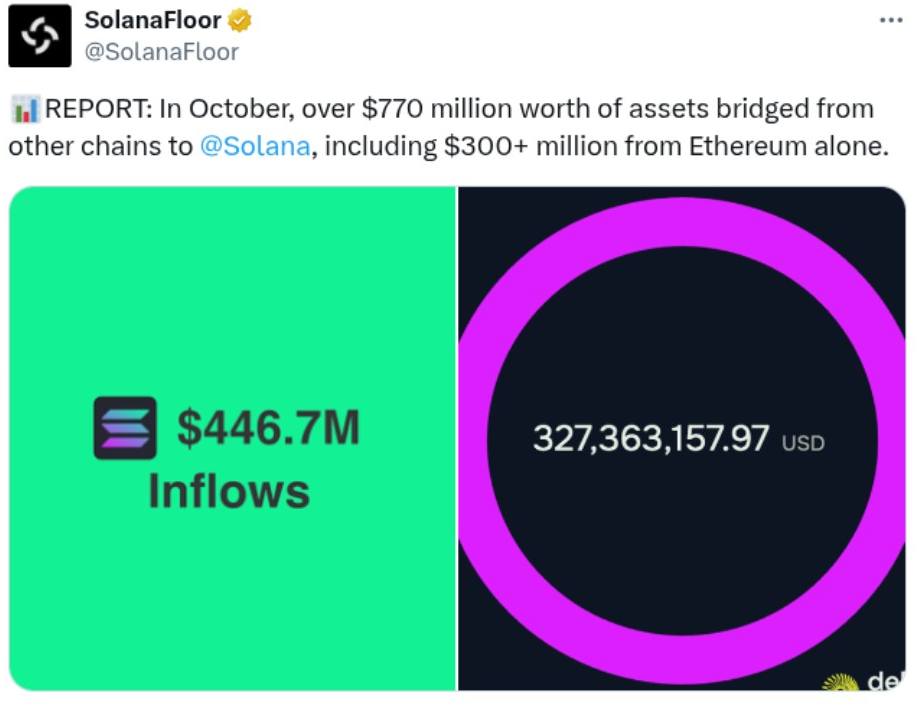
SolanaFloor reported that over $770 Million in assets were bridged to Solana in October. More than $300 Million of that came from the Ethereum network.
These inflows underscore the active rise in cross-chain activity and investor confidence, solidifying the bases of the network.
The top altcoin is trading near $178 at the time of writing, with the market anticipating a break above $200. A breach of this resistance level could spark optimism and fuel the Solana price towards $260.