
 streamoors
 IGNITION
 Injective
 Aerodrome Finance
 ZKsync
 Collector Crypt
 Sui
Sui

Dogecoin price nearing a key zone as multiple technical signals converge. Long-term structures are recognized by analysts who identify recurring patterns similar to those of previous cycle turn-ups. The latest footprint mapping indicates that market behavior may be repeating itself from previous expansions.
Footprint Signals Suggest New Dogecoin Cycle Shift
Trader Tardigrade shared a new pattern comparison of Dogecoin’s current footprint against previous market patterns. His chart showed different color-coded segments that measure past volatility waves and their responses to turning points.
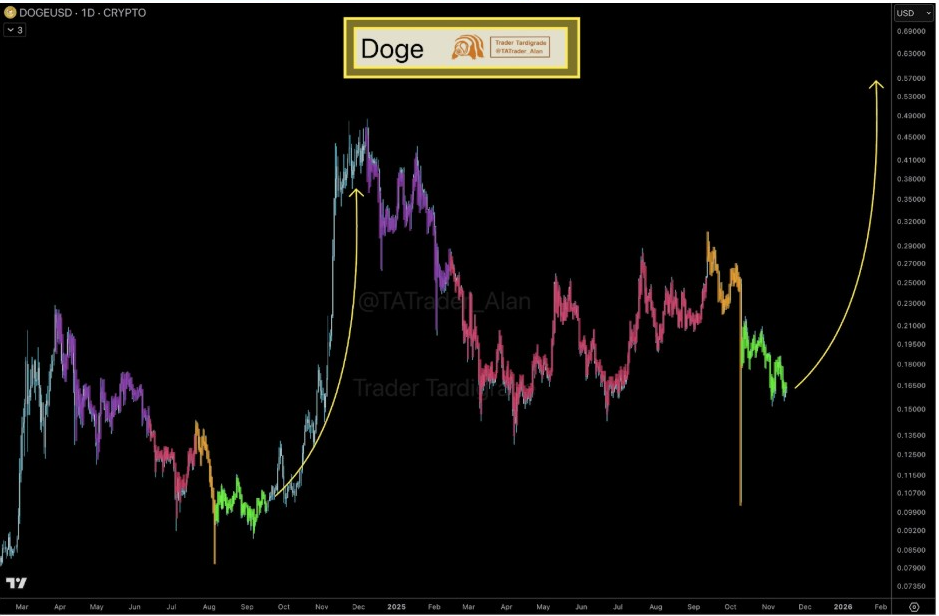
The projection of this footprint indicates a wide upside arc – comparable to a past surge in the 2021 cycle. Price action in the model shows continuous compression, followed by a violent, curved expansion that resembles prior explosive legs.
The mapping put the recent decline near the end of a corrective sequence. Tardigrade’s footprint curve then bends upward, suggesting a potential late-cycle acceleration.
His model also shows that Dogecoin often forms prolonged bases before making large upward thrusts. While the footprint will not guarantee a reversal, it shows how the asset has behaved during similar setups in previous cycles.
RSI Retest Shows Stabilizing DOGE Momentum Pattern
Furthermore, Tardigrade also shared a daily RSI retest chart that shows a significant signal at a downward-sloping trendline. The RSI dipped into the retest area and bounced slightly, suggesting that the momentum may be stabilizing.
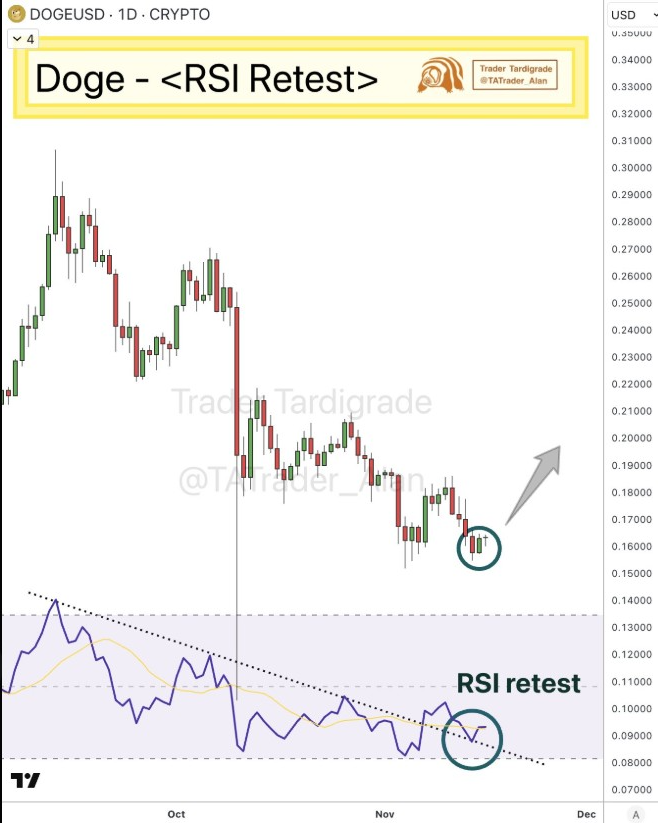
He drew this zone as a retest point, where previous downtrend momentum weakened on prior occasions. Dogecoin price continues to trade near the retest area, adding relevance to the signal.
The price chart showed small swings around $0.16, near a potential support band. Market structure is still lovely and soft, but the RSI retest is signaling a slowdown in downside pressure. This pattern occurred in previous cycles before momentum built up again.
Moreover, Tardigrade’s chart showed that Dogecoin has crossed this RSI zone multiple times during long corrections; each interaction represented a transitional momentum phase in past cycles.
Macro Cycles Point Toward Late-Stage Dogecoin Strength
Bitcoinsensus presented a macro cycle analysis of three dominant Dogecoin cycles since 2014. The chart features red and blue overlays that mark the distribution and accumulation periods. Each cycle exhibited a prolonged sideways move following a strong impulse.
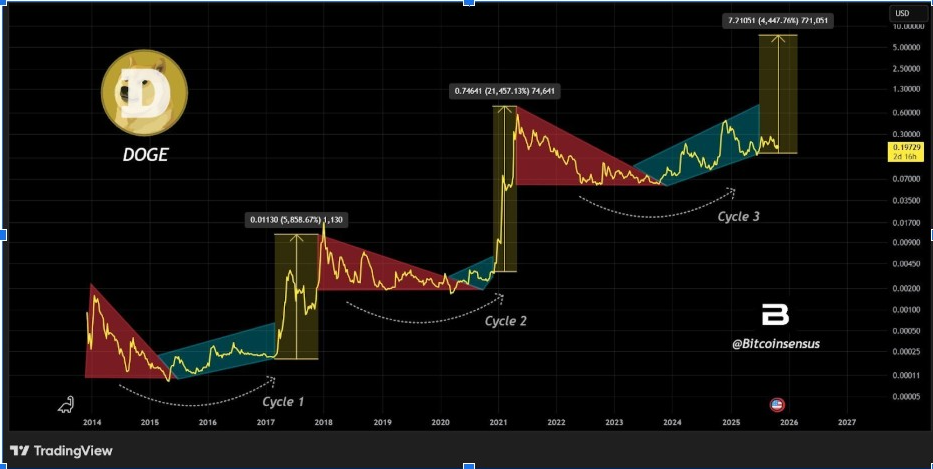
These phases eventually led to significant expansions later in the cycle. The current structure is similar to that of Cycle 2, with a long consolidation zone followed by a gradual recovery.
The model illustrated that Dogecoin price has risen through a rising blue channel in previous cycles before thrusting into steep rallies. Bitcoinsensus pointed out that previous cycles had their greatest returns late in the cycle.
Dogecoin’s current position is at the lower end of the channel, which in the past has been followed by renewed growth. The structure suggests the asset may be in the early part of its late-cycle build-up.
Wave Structure Positions Dogecoin Near Breakout Setup
XForceGlobal posted an Elliott Wave chart of Dogecoin in a classic five-wave pattern. The chart puts the current correction as part of Wave IV. A possible Wave V projection lies well above current levels, which is supported by a structured impulse map.
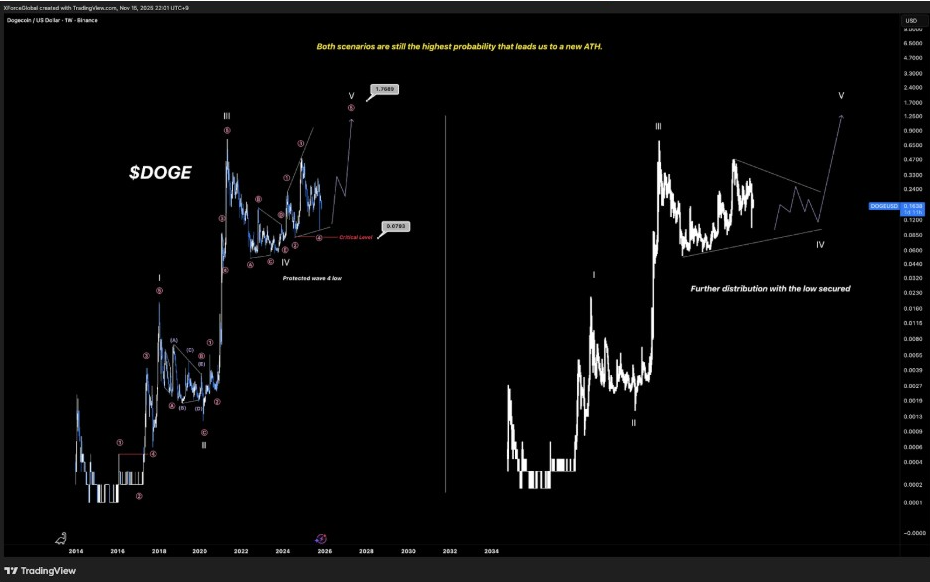
XForceGlobal demonstrated the steady formation of waves, with accumulations and breakout phases spanning several years. The wave count marks a protected Wave 4 low, and the chart shows it remains intact.
The alternative scenario also illustrates the broader consolidation that precedes an upward leg. Both of these scenarios point towards a possible continuation of the long-term structure.
Notably, Dogecoin price is trading around $0.16, which corresponds to the consolidation floor on the wave chart. The analytical model highlighted how Dogecoin has previously experienced similar corrective waves preceding strong expansions.



