Pearl
Pearl ZKsync
 Bitcoin
 Starknet
 Quantus
 Puffer
 Lighter

The altcoin market shows early signs of a structural shift. The Altcoin season index reflects momentum after weeks of decline. Current metrics reveal patterns that are often seen ahead of major rotation cycles.
Many analysts now believe that conditions are similar to those that came before strong altcoin season moves.
Altcoin Season Index Nears Critical Pivot Zone
The Altcoin season Index is near 22, which puts the market firmly in Bitcoin season territory. This lower region has historically formed around major turning points.
Market watchers focus on whether the Index begins to climb. An uptick in readings often signals upcoming altcoin season phases. A change in capital flow could bring that transition about in a short time.
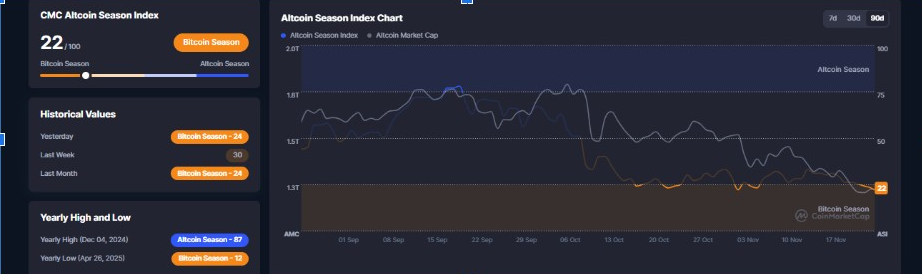
Historical data reveal that the Altcoin Season Index has frequently bottomed before a strong altcoin recovery. Traders watch and wait for the first signs of strength when the Index starts trending upward.
Because the indicator is based on relative performance, any broad outperformance of altcoins will be reflected in its next move. This pivot zone, therefore, remains an important focus area within the market.
Market Cap Structure Indicates Expansion Phase
Furthermore, the “Others” Altcoins Market Cap chart showed a tightening range with a long-term symmetrical triangle. This structure looks similar to the compression zone seen before the last 50X market expansion.
CryptoElites posted this chart, pointing out how the price continues to coil near support. A breakout from this formation could open the door for steep upside.
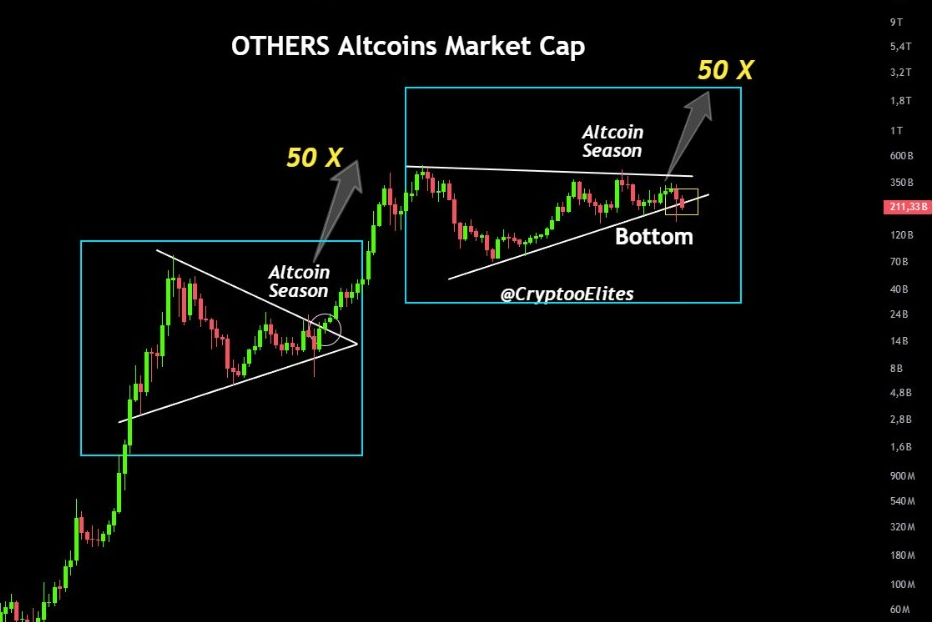
Past cycles have seen similar trends going into great rallies of altcoins. Once the volatility squeezes the price under the upper trendline, momentum often picks up.
Many of the traders use these structural cues as early signals of broad rotation. If the existing setup resolves upward, then the total altcoin market cap will potentially experience rapid expansion.
Altcoin Season Index Signals Potential Third Wave
Long-term market charts showed recurring cycles of altcoins with obvious accumulation phases. El Crypto Prof pointed out three separate altcoin seasons: 2017, 2021, and a potential third wave currently being formed.
Each season began after prolonged consolidation. The altcoin season index then showed a strong upward continuation. Current price action fits in that same accumulation structure.
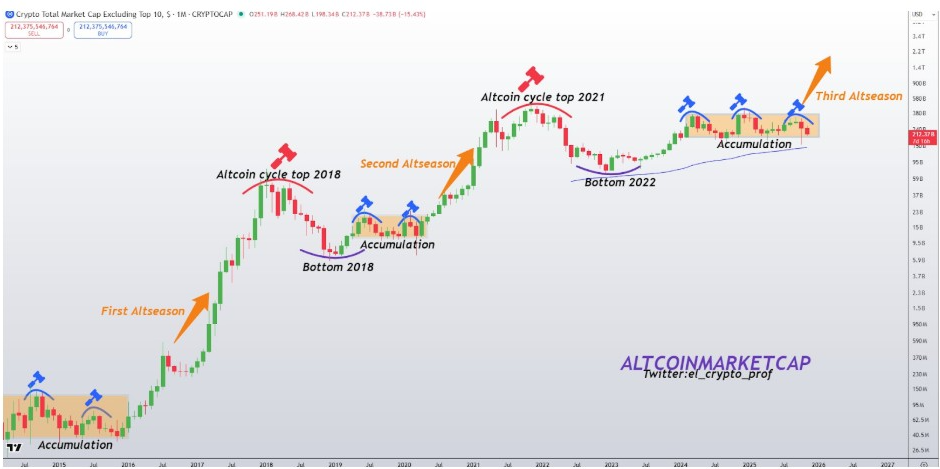
The analyst pointed out that the bottoms usually occur after multi-month drawdowns. Once the market cap has stabilized, altcoin season momentum tends to build.
Because the current range is the same as in the past, some traders believe a new expansion phase is in store. This repetitive pattern reinforces the belief that perhaps the next spin-up is on its way.
Momentum Indicators Reveal Stabilization
Meanwhile, a key altcoin market chart displayed consistently higher lows along a rising multi-year trendline. GalaxyBTC posted this structure, highlighting the historical use of each trendline retest in triggering a rebound.
The current retest continues that pattern, indicating that structural support is still sound despite recent weakness.
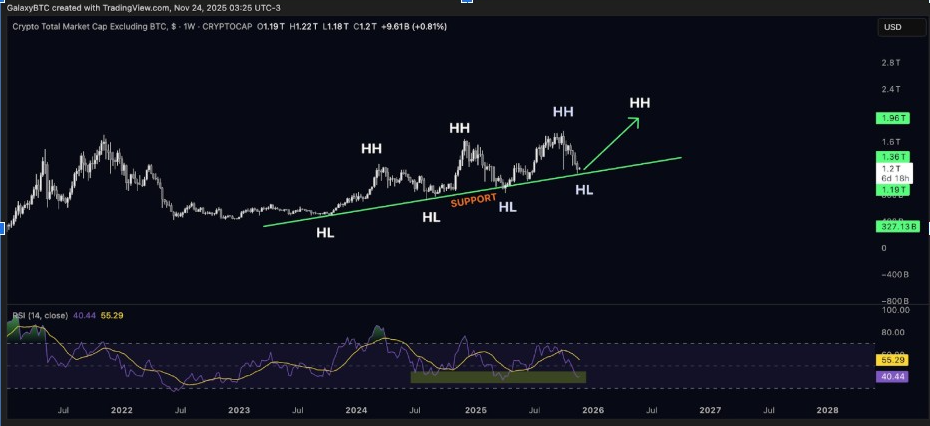
The weekly RSI is also near oversold territory, an area associated with great altcoin recoveries. When Bitcoin dominance weakens, capital tends to flow back into alternative assets. This rotation is often associated with altcoin season developments.