Zylo Ecosystem
 astronaut
 Pearl
Pearl Walrus
 Starknet
 Pudgy Penguins
 Bitcoin
Chainlink price is consolidating near a key trendline resistance. Its development activity remains strong. It outpaces every other major DeFi project.
Eight-hour Chainlink charts show steady movement. LINK has climbed from the mid-November and early December lows.
Chainlink price has experienced successive highs following the recovery between November 19 and November 22.
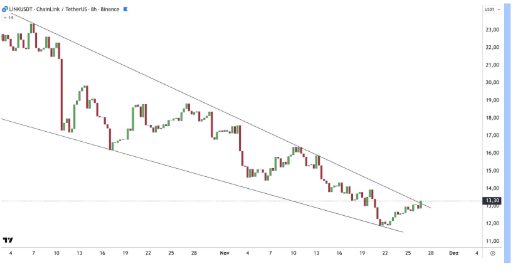
The price has returned to the top boundary of the falling wedge. This pattern has shaped the market structure for nearly two months. This puts LINK in a volatile position where movement can be either upward or downward.
The falling upper curve has topped all upward moves since October 4 to November 27. The lower limit has been run across several times and successfully defended.
Chainlink price showed a more definite response on November 10, November 17, and November 22. The last bounce, which started at about $12.00 on November 22, has initiated a slow recovery. This has taken LINK to the 13.30 zone.
This upward series of higher lows does point out growing buyer interest at every retest of the lower limit. The wedge is tightening, but the structure remains intact. This signals lower volatility and reduced trading space.
Chainlink Tops Development Activity
Development activity data shows that Chainlink is at the forefront. The dataset indicates that LINK produced more GitHub events in the last 30 days than all other projects in the DeFi industry.
Chainlink has a development score of 329.6, which is a long way above the rest of the busiest protocols. Several competitors have changed ranking positions since last month. Chainlink did not move in rank.
It still holds the top position. The data on the development activity also highlights the magnitude of the ecosystem in which Chainlink is located.
LINK is the biggest project in the presented group, with a market capitalization greater than 9 billion. It also reports the highest frequency of development.
This comparison highlights continuous engineering in Chainlink. Its protocol-level development remains strong. It surpasses newer and smaller DeFi networks.
The chart is also characterized by fluctuating price performance within the sector, but LINK is at the top. This also confirms the richness of the current cycle of development.
Historical Trend Structure Shows Recurring Downtrend Breakouts on Chainlink Price
More chart data shows two previous falling wedges that broke to the upside after a period of compression. Between late 2023 and early 2024, the Chainlink price showed a clear example of this setup.
It crossed the falling line decisively. The move sparked strong subsequent growth. Another example of a consolidation phase yielding to a definite upward movement occurred in mid-2024 after resistance was overcome.
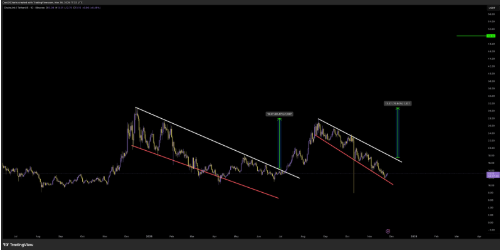
The chart shows some uniformity in the geometry, period, and slope of the prior wedges. The present structure, which operates until October and November 2025, is an extension of these previous structures.
At the same time, the Chainlink price is still forming more lows as it advances towards the upper trendline. This historical analogy highlights the current trend.
It mirrors past stages of Chainlink’s price action. The price previously moved after prolonged compression. The same pattern now appears again.