Bitcoin
 Aerodrome Finance
 Zerebro
 Starknet
 Zama
Zama Pearl
Pearl ZKsync

Dogecoin price regained strength after pivotal market shifts. Traders were seeing improving conditions on major timeframes. Analysts watched several bullish triggers forming simultaneously.
Dogecoin Price Strengthens as Whale Activity Falls
Dogecoin price demonstrated strong resilience amid a dramatic decline in whale activity. According to Ali Charts, whale transfers hit a two-month low. This reduction implied a reduction in selling pressure on major pairs.
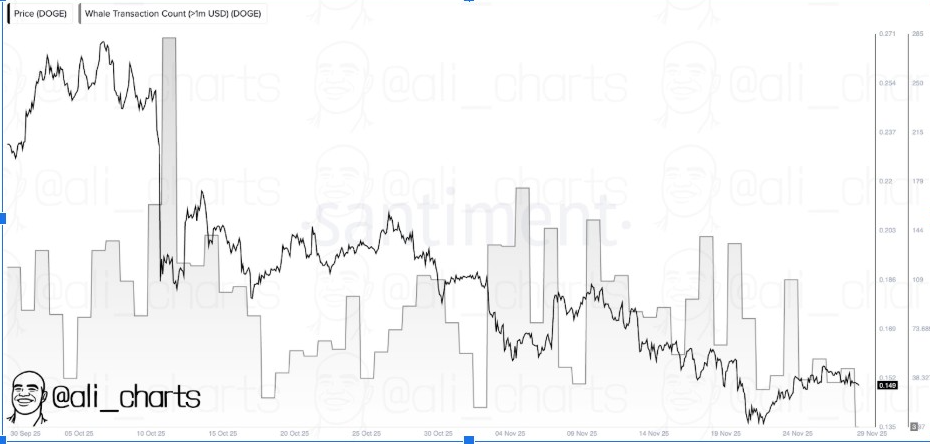
Santiment confirmed smaller movements above $1 million. These declines are often indicators of holding behavior among major wallets. A holding trend typically reduces volatility over short-term windows.
Less whale activity also entices smaller buyers. Many traders like to accumulate in calmer markets. This phase enabled the creation of stable entries near the current ranges.
The decrease in whale transactions often favors balanced consolidation. Balanced consolidation is helpful in preparing markets for directional moves. These signals boosted confidence over near-term stability.
Bullish Pennant Structure Signals Potential Breakout
Trader Tardigrade pointed out a bullish pennant on the 4-hour chart. The structure developed after a clean upward impulse. DOGE price was then squeezed between converging trend lines.
Bullish pennants are often a sign of continuation. Traders look for breaks of the upper boundary. The chart depicted an increasing pressure towards that resistance.
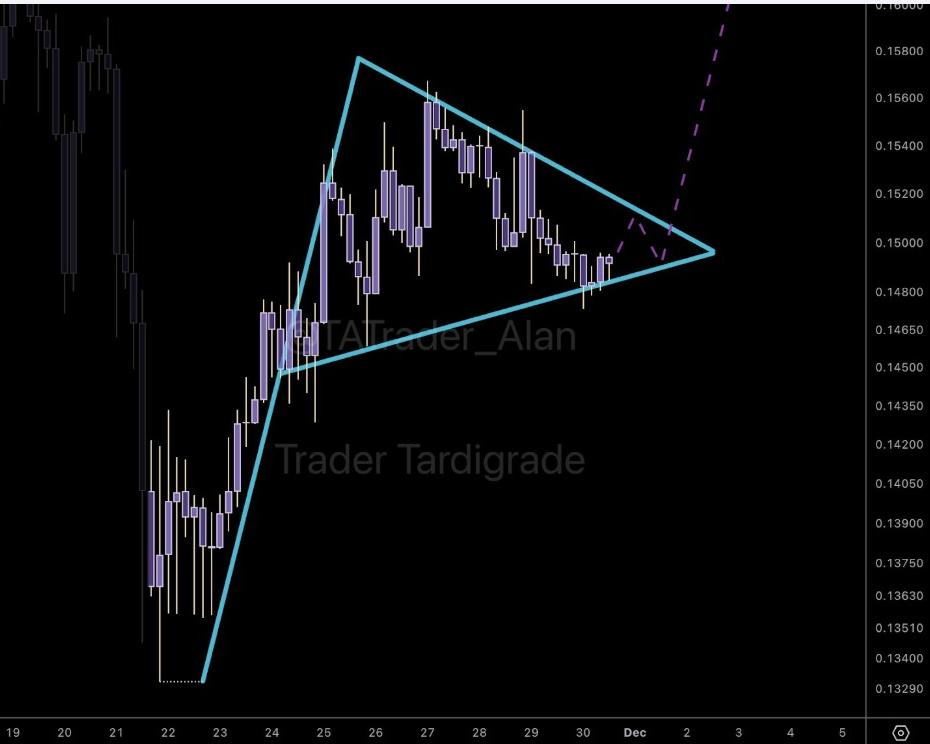
The pattern formed within a quiet zone of volatility. Calm zones frequently have controlled consolidation phases. These phases form energy to expand in the future.
Tardigrade’s chart indicated an upward trajectory. The dashed line was the possible breakout direction. Traders were monitoring liquidity levels around key resistance.
This setup was bullish in the short term. It also coincided with previous accumulation signals. Many watchers were expecting a reaction after the compression was over.
Breakdown and Rebound Indicate Accumulation Phase
Furthermore, trader Tardigrade also pointed out the recent breakdown and instant pump. Dogecoin fell and touched below support before buyers intervened. The bounce showed active traders in force.
Breakdown-then-pump structures often suggest accumulation. Large buyers may sometimes force dips to secure better positions. Rapid rebounds bring together interest near key levels.
Notably, a 3-day chart favored this view. Dogecoin reclaimed lost support with strong momentum. The candle formation indicated strong directional intent.
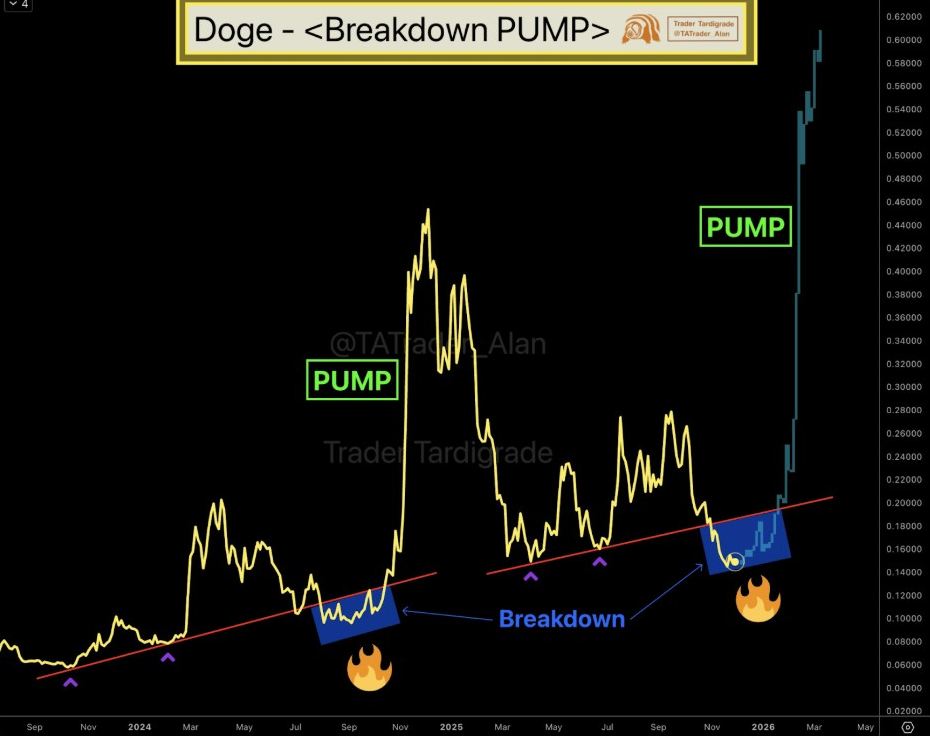
This pattern reinforced the expectations of continued strength. Multi-timeframe alignment boosted bullish trader confidence. These signals showed an organized interest in present ranges.
Breakdowns followed by sharp pumps are a common occurrence near demand. Demand zones result in floors during volatile phases. Dogecoin controlled these zones with notable consistency.
Such movements tend to be followed by heavy expansions. Expansions are usually preceded by periods of quiet accumulation. Traders were on the lookout for new liquidity pockets.
Weekly Structure Points to Long-Term Market Strength
Meanwhile, analyst Healthy Assets took a look at the broader weekly structure. The chart showed tight consolidation between the historical floors. These supports held firm during the recent market swings.
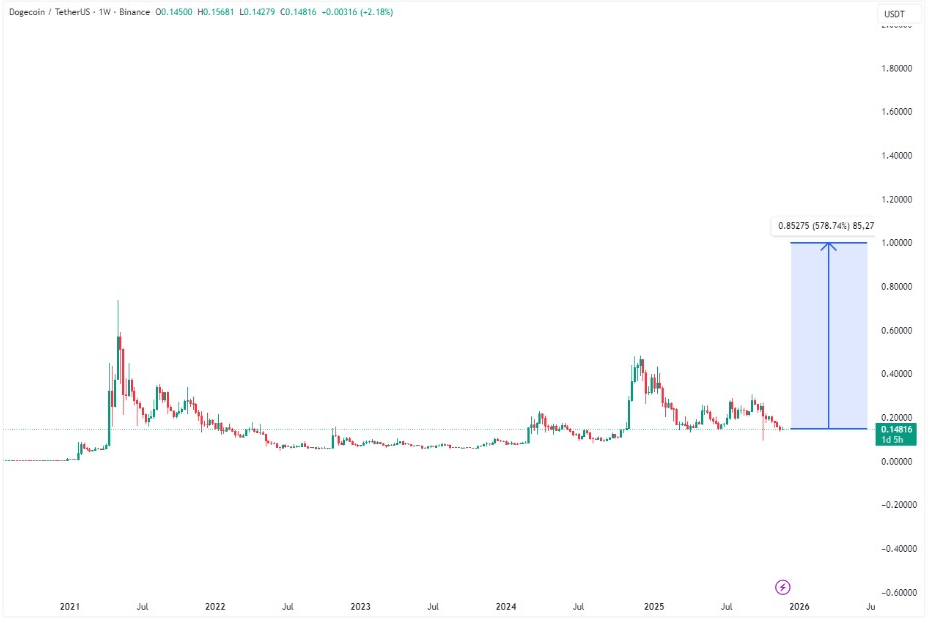
Healthy Assets projected a massive increase from current levels. This projection showed a wide structural setup. Weekly candles formed stable higher lows over several months.
Long-term resiliency was positive for overall market sentiment. Traders interpreted these signals to be supportive of steady growth. The consistency favoured analysis of long targets.
Weekly charts often have hidden strength. Hidden strength is evident in ranges squashed for months. This compression positions markets for big moves.
Healthy Assets raised the issue of a multi-month pressure zone. Pressure zones are often indicative of energy building below resistance. This area served as a potential breakout point.
The analyst was observing strong reactions at key trend levels. These reactions demonstrated commitment by greater market players, as combined signals provided an improved long-term view.