
 Zylo Ecosystem
 Walrus
 Bitcoin
 Sui
Sui Quantus
 Quant
Quant Starknet

XRP price is testing a critical structural zone near $2.30 as selling pressure meets long-term support. Current price movement shows signs of reversal to a previous breakout zone and a major moving average. Analysts pointed to capitulation signs and trend-channel support converging at existing levels. Ripple price is at a resolute technical and liquidity inflection point.
XRP Price Tests $2.30 Macro Throwback Zone
According to analyst EGRAG, XRP price is revisiting a major breakout band near $2.30. This level capped progress earlier, before the price skyrocketed. The chart shows the move as a macro throwback retest of previous resistance. These retests are common during trend continuations in crypto markets.
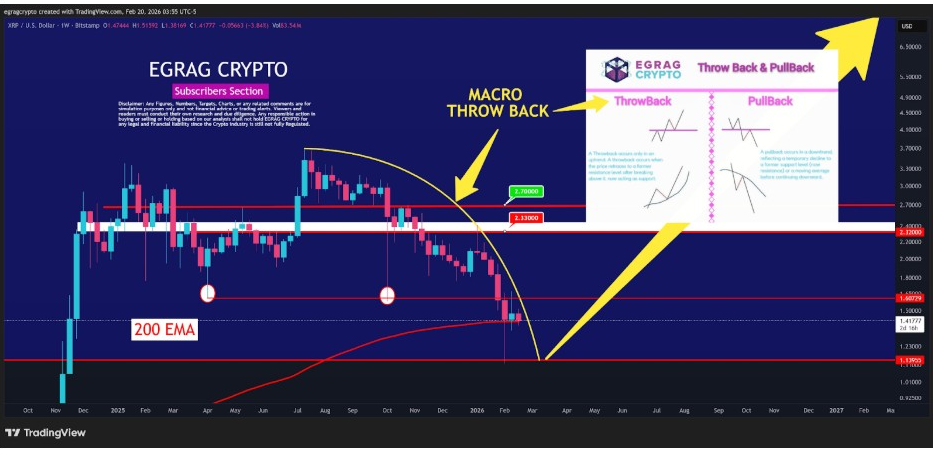
The analysis shows the 200 EMA near the $2.0 zone. Short-term momentum was recently lost, and consequently, the price has fallen towards this dynamic support. This is the average that XRP has historically observed in times of bullish macro cycles. XRP price holding above this zone would confirm structural support rather than trend failure.
Nevertheless, the throwback structure would be nullified by a consistent failure at the bottom of the $1.13 zone. Such a situation may subject the asset to further retracement points below the previous consolidation zones. The estimated recovery curve indicates that liquidity would be absorbed if support holds. The structure therefore centers on defending the breakout zone.
Meanwhile, the chart interprets current weakness as a structural retest rather than a collapse. Price interaction with the macro band remains the dominant technical signal. XRP price reaction at this level determines whether continuation remains viable. This zone currently defines the market’s key equilibrium boundary.
Realized Loss Spikes Signal XRP Price Stress
Additionally, on-chain metrics by analyst Steph Is Crypto indicate drastic spikes of realized losses across the network. The indicator shows repeated negative extremes that are usually an indication of widespread dumping at a loss. Such events are common in the capitulation stages.
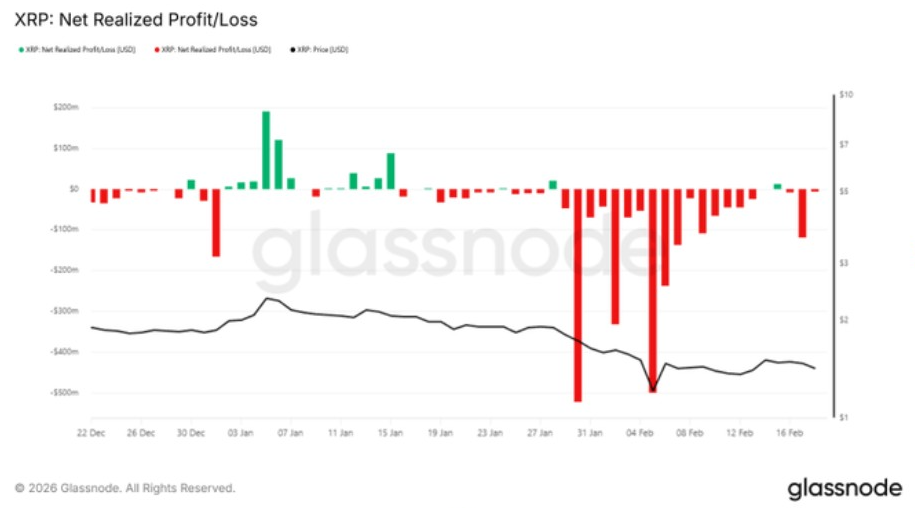
Importantly, forced selling by short-term players is indicated by the clustering. Stabilization of prices after such events implies that stronger holders are absorbing supply. In the past, local price floors were coincident with the extremes of realized losses. This pattern reflects redistribution rather than sustained distribution pressure.
Moreover, previous cycles exhibited recovery periods that were realized after extended losses. When selling pressure subsides, supply resets cause overhead resistance to reduce. If realized losses begin to moderate and the price stabilizes, structural balance can be achieved. Such a dynamic may establish the conditions for the gradual normalization of the market.
Meanwhile, Ripple price is vulnerable to on-chain supply actions. Capitulation signals do not give a certain direction but indicate the position of participants. The indicator emphasizes affective selling rather than structural failure. Such information represents the up-to-date situation as a stage of redistribution.
Long-Term Channel Guides XRP Price Structure
In the meantime, according to analyst ChartNerd, XRP price is interacting with a broad ascending trend channel. The chart shows price pulling back toward a macro support zone. This zone aligns with a historically respected moving average. Previous cycles saw rebounds from similar structural levels.

The recent rejection near the higher price zones is an indication of diminishing momentum. But the structure remains long-term above the rising channel support. Past market history shows a strong cyclical reversal within a broader bull market. Pullbacks of this kind usually precede renewed expansion stages.
Additionally, projected extension levels on the right side of the chart derive from prior cycle movements and structural symmetry. The current price reflects uncertainty at support, indicating that the market is positioned between a continuation and a corrective expansion.
Furthermore, the macro support band now defines structural stability for the asset. A decisive breakdown below the trend floor would shift long-term structure. Until then, the price remains inside an established upward channel. Therefore, XRP price remains at a pivotal long-term decision zone.


