Quack AI
 Bitcoin
 Lighter
 Injective
 Pearl
Pearl Zcash
Zcash Sui
Sui

Bitcoin price is approaching the low-70,000 region as analysts monitor various technical and derivative indicators to make the next move. The current chart formations place immediate emphasis on support around $67,000 and resistance around $72,000. At the same time, options positioning has drawn attention to $75,000 as a possible short-term magnet for expiry. That combination has sharpened the latest Bitcoin price discussion, with traders weighing whether the recent bounce can extend into a broader recovery.
Bitcoin Price Bounces From Support
According to Pepa’s 3-day chart, Bitcoin is repeating a structure seen after a prior sharp decline. In both cases, the price fell sharply before stabilizing within a tight, upward-sloping range. The current setup is between a support line trending upward and a resistance line sloping downward.
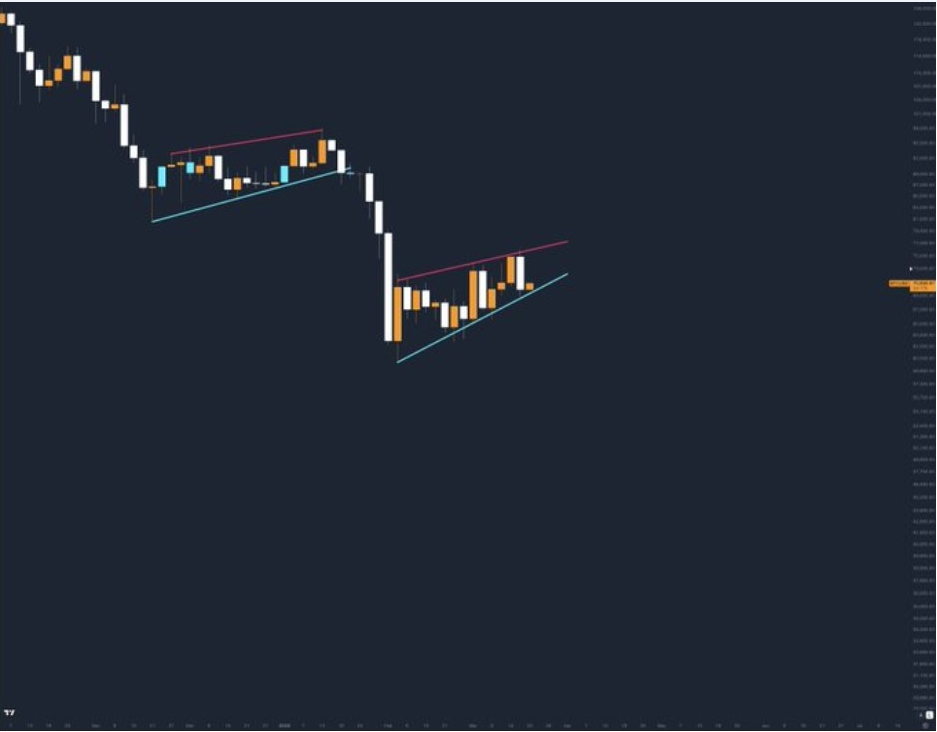
This shapes a bear flag, a pattern that frequently appears during a larger price decline. These formations tend to develop when prices take a breather after a significant fall. In this case, the latest bounce has kept short-term momentum positive, with candles turning green from support. Even so, the upper boundary remains the main level that must be cleared.
Moreover, the repetitive pattern of the setup indicates a fractal sequence in the current action of Bitcoin price. The last consolidations within the same channels ended with strong directional moves. BTC price may still probe higher within the range as long as the rising support is held. That keeps the red trendline as the immediate technical barrier.
BTC Price Tests $70K-$71K Retest and Rejection Zone
According to Nehal’s chart, Bitcoin has returned to a previously flipped zone near $70,000 to $71,000. That zone had earlier shifted from resistance to support after a breakout. Price is now retesting the same band, making it a key decision zone. The chart suggests sellers are still active there, which raises the risk of a rejection.
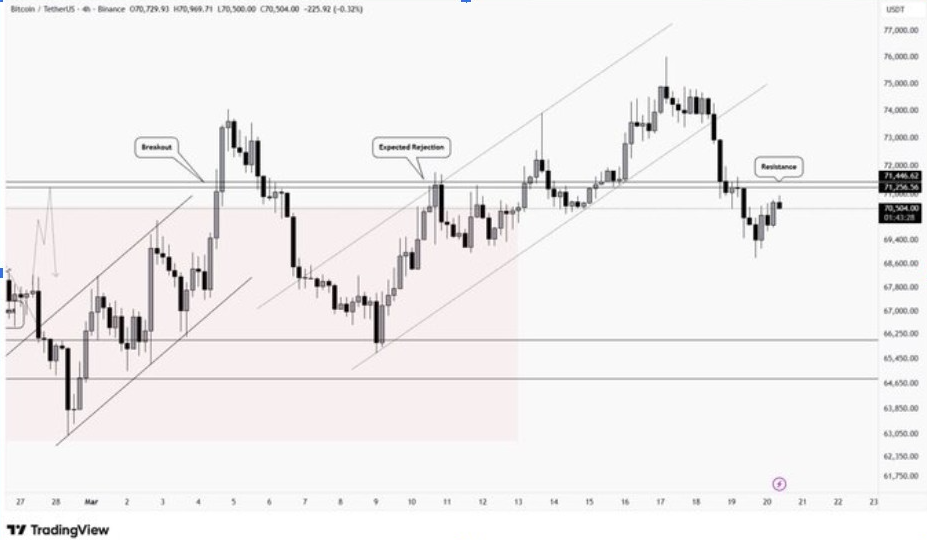
More so, the setup reflects a common retest structure after a breakout from consolidation. Bitcoin moved above the zone before pulling back. However, the presence of an upward channel and prior rejection points adds weight to the supply area. That leaves the current Bitcoin price reaction especially important.
If BTC price is rejected here, the move could form a lower high and open room back toward $67,000. That lower area remains the nearest downside support zone visible on the chart. In contrast, a successful hold above the retest band would strengthen the case for continuation. That could place higher levels back in focus.
Additionally, a strong seller response would reinforce the resistance view. A firm reclaim, however, would suggest that the market has absorbed supply in the zone. In that case, Bitcoin price could begin building toward the next major objective.
Options Market Points Bitcoin Price Toward $75K
Meanwhile, EllaWeb3’s options chart shows notable positioning across several strike prices ahead of expiry. One of the largest put concentrations sits at $20,000, with a notional value of nearly $596 million. While that appears bearish on the surface, the strike is far below spot. That makes it less relevant for the immediate Bitcoin price direction.
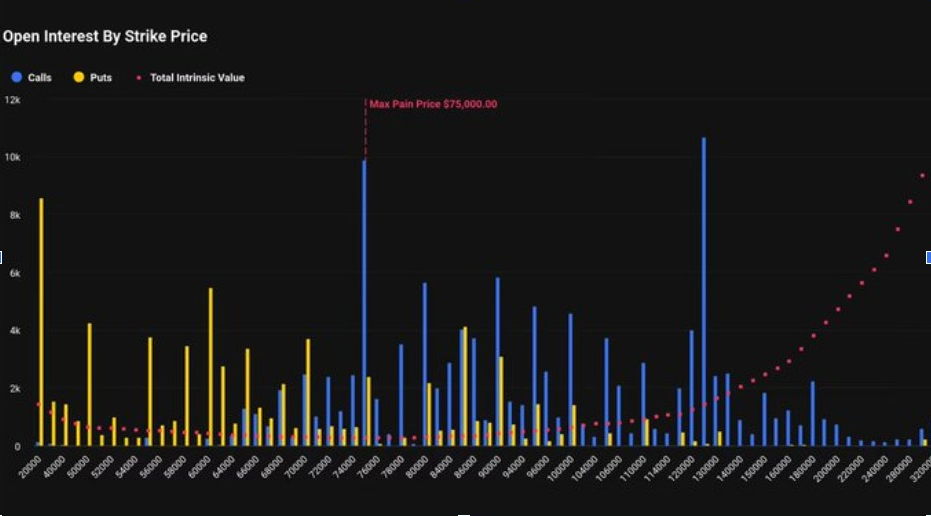
More telling are the large open-interest clusters around $75,000 and $125,000. Those strikes show that traders are positioned across a wide range of outcomes. In addition, the put-call ratio stands near 0.63, indicating a slight bullish lean. Calls still outweigh puts, which tempers the bearish interpretation of deep out-of-the-money protection.
The chart also identifies $75,000 as the max pain level. That is the area where the most options would expire worthless. In many cases, price tends to drift toward that zone as expiration approaches. For that reason, the current Bitcoin price setup is being measured against the $75,000 level.