Boomer
 Covenant x402
 Pearl
Pearl Claudia
 Solana
 Bitcoin
 Quantus
- BitcoinSV bulls might get squeezed in the near future, bulls trying hard to sustain.
- BSV price might see a fall in the short run if it fails to break crucial resistances.
- BSV/BTC is trading at 0.00294200 BTC with an intraday change of -1.30% while the BSV/ETH pair is trading at 0.04255234 ETH with an intraday change of -4.32%.
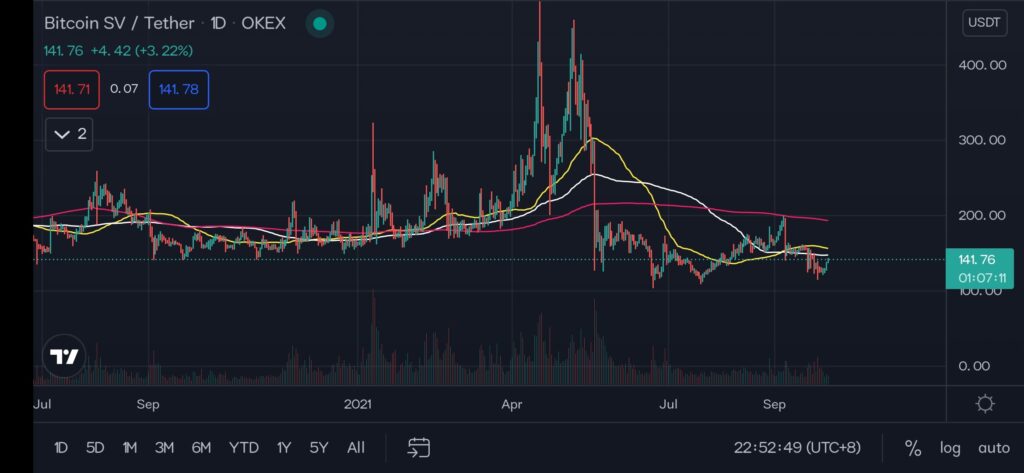
BSV is currently trading below all the significant 50, 100 and 200-day moving averages. This is something the bears might want to cherish. There is an immediate resistance in the form of the 100 days moving average above the current trading price. The bulls would desperately like to break this resistance and stay above it.
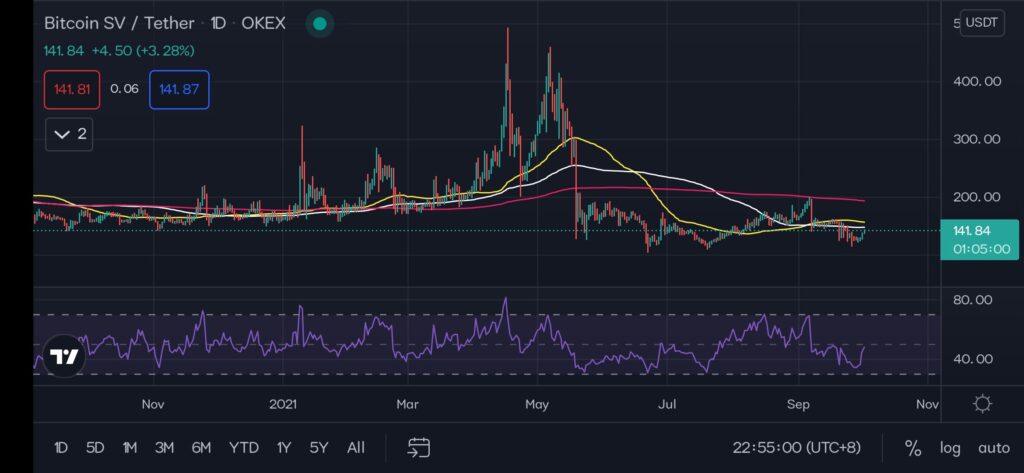
The relative strength index (RSI) has made a U-turn recently from the oversold zone and is trying to reach the normal zone. The RSI line is still below the normal zone indicating the bears are in control. The bears would try to keep suppressing the price here thereby not allowing the RSI line to go above the normal zone.
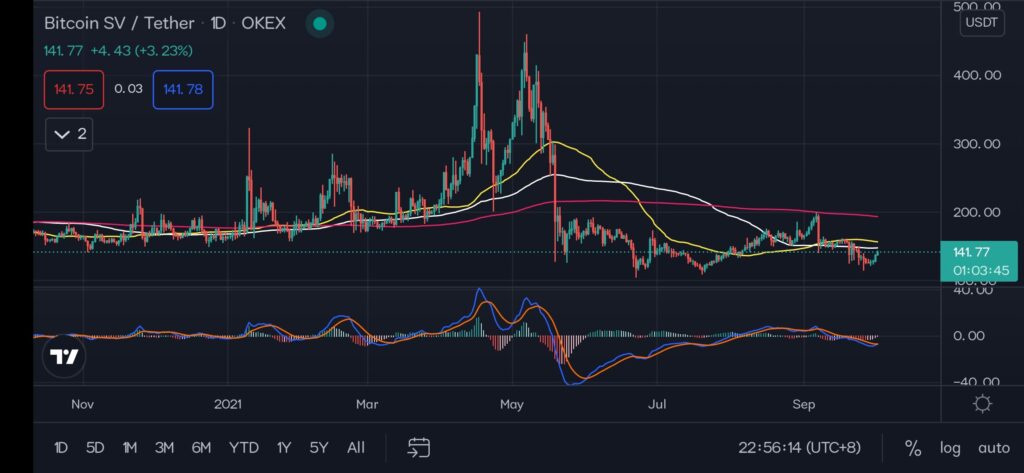
The Moving Average Convergence Divergence (MACD) is also referring to bearish momentum. The MACD line and the signal line are both below the Zero line indicating the price is in the bear’s territory. The MACD line is below the signal line and wanting to cross it from below, if the MACD line manages to cross the signal line we might see a price rise. But there will be crucial resistance levels to watch out where there might be selling pressure.
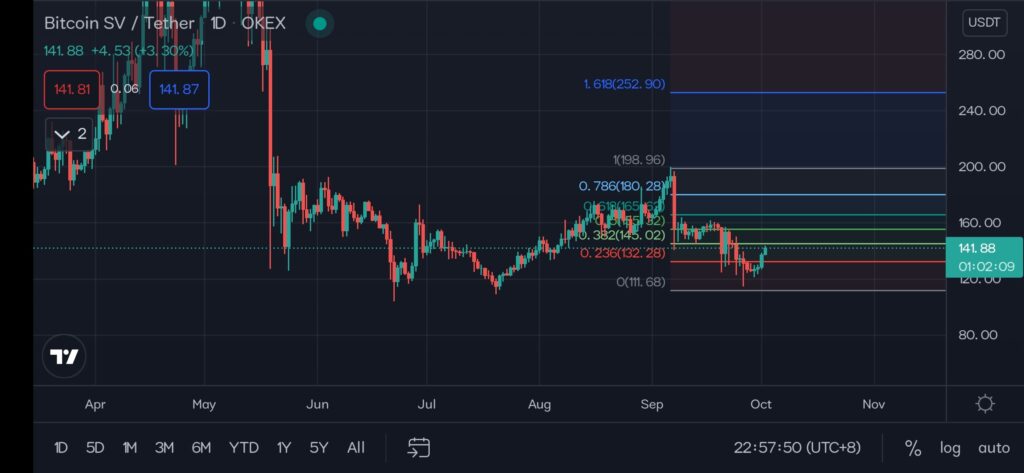
The Fibonacci indicator is suggesting an immediate resistance at the $145 price level. The $155, $165 and $180 price levels will also act as significant resistance. The support levels indicated by the Fibonacci are the $132.28, and $111 price levels.
NOTE: The moving averages of 50, 100, and 200 are in color Yellow, White, and Red.
The MACD line is colored Blue and the signal line is colored Red.
The important support and resistance levels to keep an eye on are:
SUPPORT: $132.28, and $111
RESISTANCE: $145, $155, $165, $180
TAKEAWAY: Considering the technicals mentioned above the price of BitcoinSV is expected to face stiff resistance in the levels directed above. We might see a pullback from the resistance levels in the near future if the price fails to break the resistance levels.