Walrus
 Quantus
 Pudgy Penguins
 Bitway
 Quant
Quant Sui
Sui Bitcoin

Ethereum price is back in the price zone that can either wake up the market or trap late bulls again. After weeks of heavy selling and sharp rebounds, ETH crypto now sits near $1,800, with analysts watching one monthly level that could shape the next macro move.
The setup has become bigger than a short-term bounce. Traders are tracking a possible inverse head-and-shoulders pattern, a defended $1,750 support zone, and an ETH crypto dominance chart that hints at a wider rotation into Ethereum.
Ethereum Price Watches $2,050 Monthly Close
Ethereum price is hovering near $1,800 after climbing from the lower support region around $1,550. The token has recovered enough to challenge the first major resistance band, but the larger test sits higher.
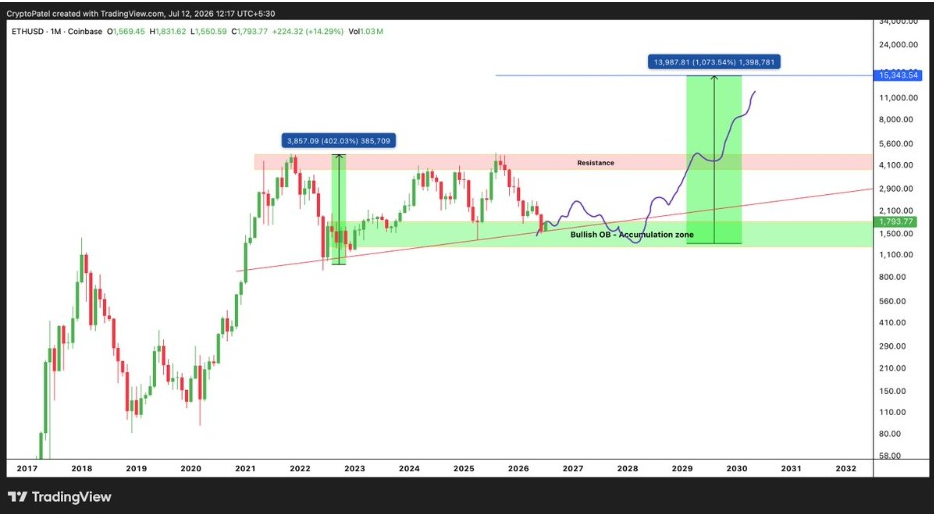
Crypto Patel said Ethereum’s July monthly close could decide the next major trend. His chart places $2,050 as the line bulls need to reclaim before the broader bullish case gains strength.
A monthly close above $2,050 would shift attention toward $4,000 and potentially a new all-time high in this cycle. The same chart shows ETH trading above a long-term rising support line while holding inside a broad accumulation zone.
The bullish order block sits around the $1,500 to $1,700 region. That area has helped buyers absorb selling pressure after the recent breakdown.
If ETH crypto fails to reclaim $2,050, Patel expects a deeper correction toward the $1,300 to $1,000 demand zone before the next major expansion. That makes July’s close more important than the daily noise around $1,800.
ETH Crypto Inverse Pattern Puts $1,967 in Play
Elsewhere, Henry sees Ethereum forming a bullish inverse head-and-shoulders pattern. The setup shows a left shoulder near early June lows, a deeper head later in June, and a right shoulder forming as price pushes back toward resistance.
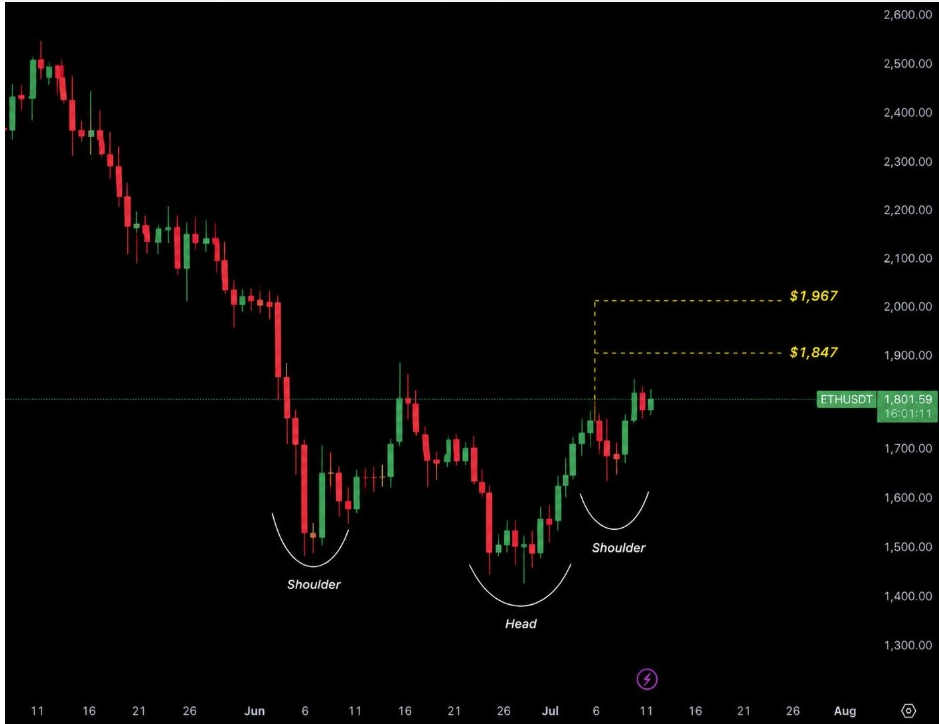
For the pattern to confirm, ETH crypto needs to break above the $1,847 to $1,967 resistance zone and then hold that area as support. A clean move through that range would strengthen the short-term recovery structure.
That zone also lines up with the broader $2,000 area watched by traders. A breakout would not only clear the neckline but also place ETH closer to Patel’s $2,050 monthly trigger.
The chart suggests buyers have already started building higher lows from the late-June bottom. Still, ETH has not yet delivered the confirmation candle that would validate the pattern.
A rejection below $1,847 would keep ETH inside its recovery range. A close above $1,967 would turn the setup more aggressive and bring $2,050 back into immediate focus.
ETH Price $1,750 Support Keeps Bulls Alive
For now, Ted Pillows is focused on the $1,750 level. He noted that Ethereum price is still holding above the February 2026 lows, which keeps the short-term uptrend intact.
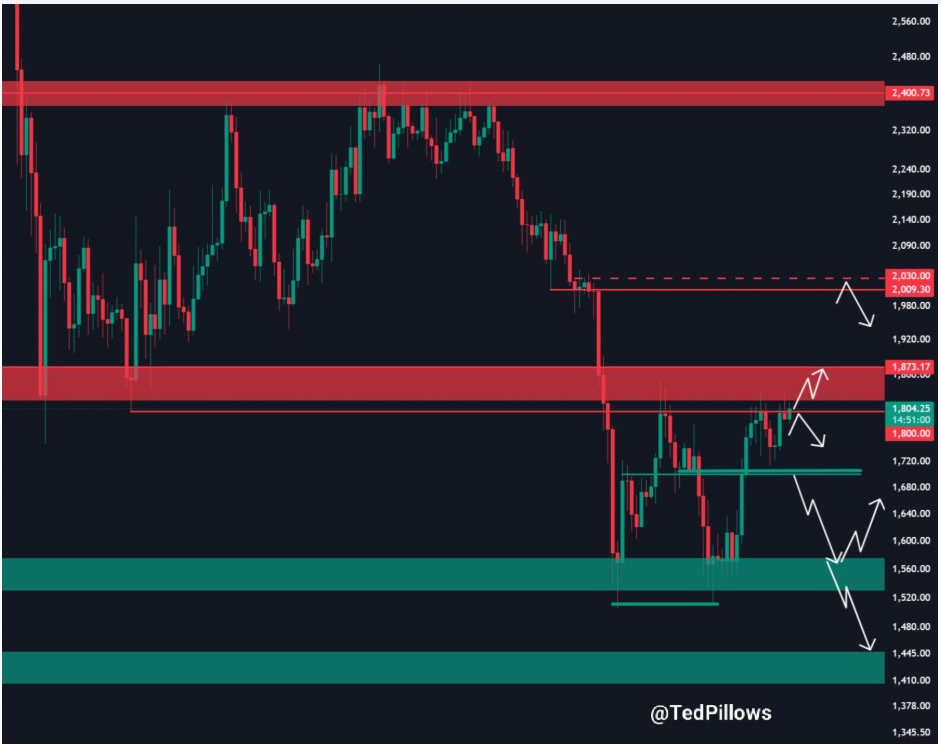
His chart showed ETH crypto pressing into the $1,800 area, with nearby resistance stretching toward $1,873. A breakout through that red supply zone could send price toward $2,009 to $2,030.
That would place ETH just below the $2,050 monthly level highlighted by Crypto Patel. The overlap gives traders a clear roadmap: hold $1,750, clear $1,873, then challenge $2,030 to $2,050.
If sellers regain control, the first support sits near $1,700. A deeper pullback could send ETH back toward $1,560, where buyers previously stepped in.
Ted’s downside map also leaves room for a wick toward the $1,445-$1,410 zone if $1,550 breaks. That would weaken the bullish case and delay any move toward $2,050.
Across the dominance chart, Don is watching Ethereum’s share of the crypto market. His chart showed ETH dominance pressing against a long-term descending trendline after years of lower highs. A confirmed breakout could signal stronger ETH performance relative to the broader crypto market.