Minter
 Quack AI
 Pearl
Pearl Pons
Pons Bittensor
 Ethena
 Quantus
- Kusama coin has fallen 24% in the day during the bearish trend.
- Kusama coin’s previous day trading volume jumped by 36.5%, and Coin lost 70% cost from its 8 month’s highest peak.
- At the time of writing, KSM/BTC pair price is negative by 13.10% at 0.005191 BTC
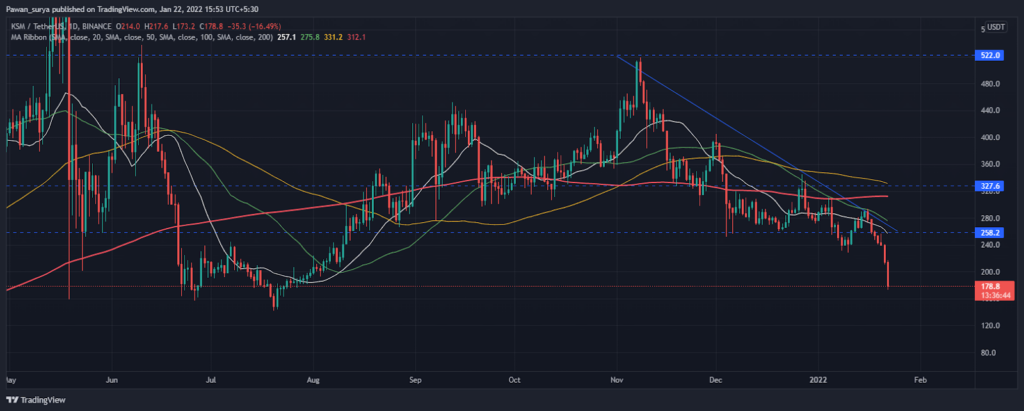
Despite getting rejected from the $516.6 mark, KSM Coin is falling gradually by making the downward wedge pattern in the daily time frame; whenever KSM Coin tries to break this rising pattern to the rising side, the sellers rattle it downward. The whole market is currently bearish according to the current market situation.
At the time of writing, the Kusama coin fell 23.29% now at $179.50, creating a scary scenario for investors as it is almost ¼ part of the asset. Over the past 24-hours, trading volume pumped by 36.5% at $97.6 million ( sellers dominating the market). However, KSM/BTC pair price is negative by 13.10% at 0.005191 BTC, same as 6.77% at 0.07554 ETH. Currently, an asset has 0.10% market dominance, and the Volume/Market cap ratio is 0.06321.
While moving lower from 3 months’ highest peak (from $517), the KSM Coin reflects selling on-rise formation and Coin has fallen 37% this week, and recently, Coin’s price breached descending triangle pattern. $258 was the critical point of volatility when coin mover near this level, investors bought the asset but sellers attempted brokedown this verge at the second attempt.
Kusama Coin Broke Down Descending Triangle Pattern
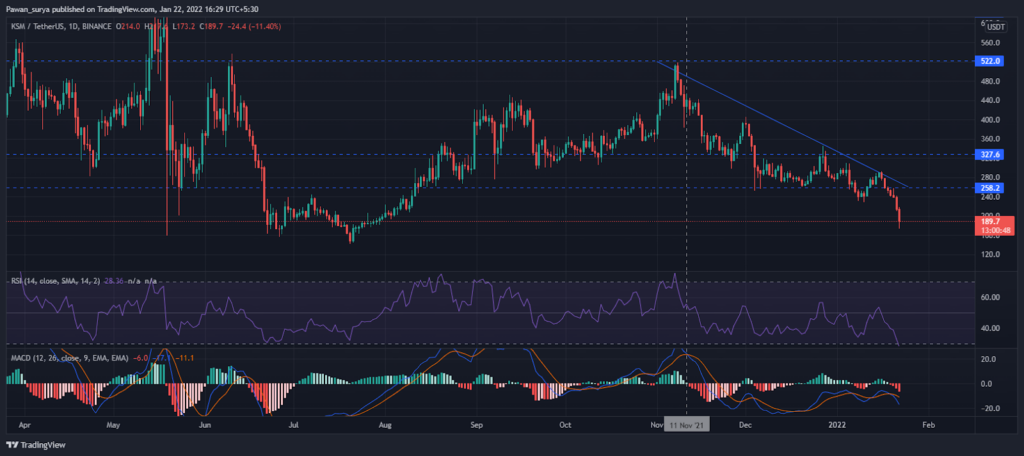
When holders attempted to convert KSM coin’s trend to the flip side and failed on coin hold above the 20 and 50 MAs, bears came into existence and dumped the coin. Now KSM is continuing a robust bearish phase because pivotal moving averages (including 20,50,100, and 200 MAs) are far from the current price (above coin’s price). If the Kusama coin recovered its loss, it might resist the following MAs.
RSI dipped into the oversold territory after seeking hail-line of RSI twice. Now it is at the 28 mark and may retest 20 levels soon. However, MACD generated the bearish crossover on 11 Nov. The indicator is surviving in the negative area and probably spending some weeks to overcome the negative zone.
Conclusion
In the current outline, everyone knows that bitcoin dominates the entire cryptocurrency while Kusama coin faces selling pressure. KSM appears week until it finds a recovery level for the further week. If the coin continues the bearish trend, it may reach the $144 pivotal mark.
Resistance level- $258.8 and $327
Support level- $144.05
Disclaimer
The views and opinions stated by the author, or any people named in this article, are for informational ideas only, and they do not establish the financial, investment, or other advice. Investing in or trading crypto assets comes with a risk of financial loss.