
 Boomer
 Minter
 Pearl
Pearl Pudgy Penguins
 Sui
Sui Covenant x402
 Pump.fun
- The Anchor Protocol token price is trading higher near the supply zone, suggesting the V-Shape recovery.
- The Anchor Protocol token price is training above the significant moving average ( such as 20,50,100, and 200 MAs) over the daily price chart.
- The ANC/BTC pair price is trading at 0.00008943 satoshis, bullish by 11.21%.
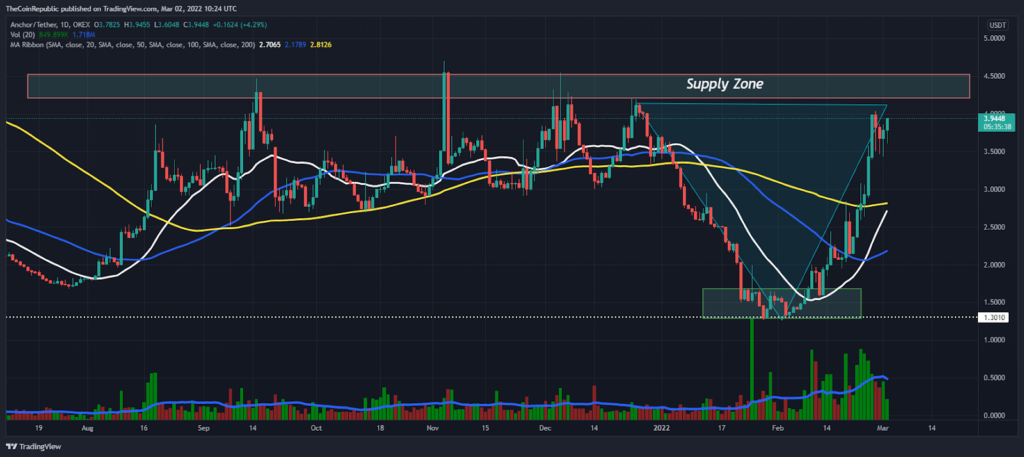
The Anchor Protocol token price had been underperforming from late December to early Feb. The ANC price retested the supply zone multiple times (noted in the graph). During early February, the ANC investors accumulated the token price in the horizontal box (green). Over the past 4-week, the buyers have been celebrating an extreme bullish momentum (almost 200% increase).
Anchor Protocol token price is rising again after a few retracements. At the time of writing, the ANC token price is trading at $3.95, up 13.8%. However, the coin has seen a 63% increase in trading volume over the past 24 hours. The daily volume bar has remained above the average line (blue) for the past several days. Meanwhile, the volume to market capitalization ratio is 0.1143. Furthermore, the Market Cap to Total Value Locked ratio is 0.08685.
ANC/BTC pair price is trading at 0.00008943 satoshis, up 11.21%; Anchor Protocol token price with Ethereum pair is trading bullish at 0.001315 ETH. USDT pair or ANC crypto is trading above important moving averages (including 20, 50 and 100 MA) in the context of the daily price chart.
Whether or not bear is able to reverse the trend near the supply zone
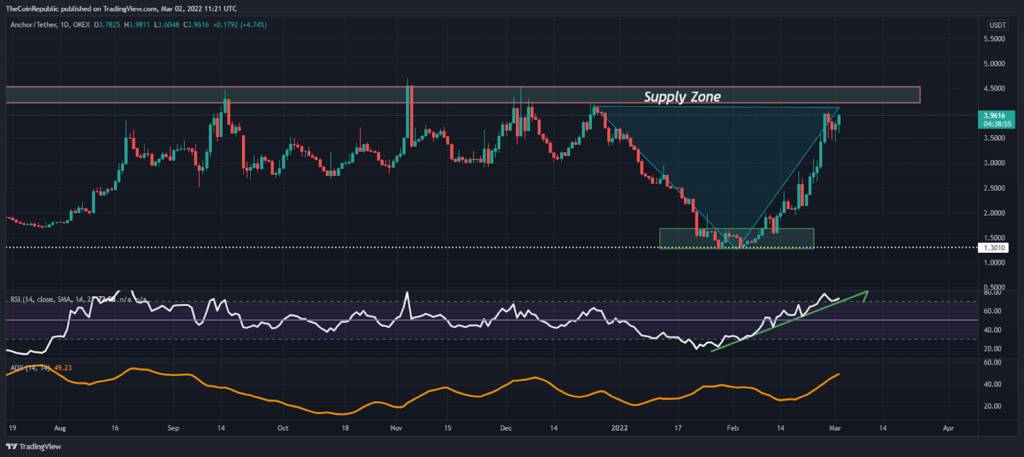
The Anchor Protocol token has immediate support at $1.30 (recent low), and resistance sits at $4.5. The token price is showing a V-shaped recovery in the context of the daily price chart. The bull market needs to move above the supply zone with high trading volume as the bears have a good selling point there.
The RSI is seeing a sharp rise after dipping into the highly oversold zone. The RSI noted a bullish trend (green) on the daily price graph during the rise. Meanwhile, RSI is turning against panic sellers and is moving into overbought territory. Moreover, the average directional index continues moving higher and suggests the extreme bullish momentum for the Anchor Protocol token.
Conclusion
There is no doubt that the Anchor Protocol token is in extremely bullish territory. But still, bears have a dominating point near the supply zone. If bulls succeed to sustain above $4.50, we could expect the fresh bull run.
Resistance level- $4.5 and $7.0
Support level- $1.30 and $1.0
Disclaimer
The views and opinions stated by the author, or any people named in this article, are for informational ideas only, and they do not establish the financial, investment, or other advice. Investing in or trading crypto assets comes with a risk of financial loss.




