Universal High Income
 Pudgy Penguins
 Aerodrome Finance
 Axis Robotics
 Pearl
 Pons
 Zcash

- Theta Network coin is performing poorly in a falling wedge pattern on the weekly price chart.
- Buyers barely dominated the THETA coin for more than three weeks above the crucial hedge level of the $1.0 mark.
- Theta coin is down 4.2% with the bitcoin pair at 0.00004039 satoshis.
Theta Network price has continued to rise on higher time frames, daily and within a falling wedge pattern. Price action thus reflects a selling opportunity in each rise, so investors lost nearly 93% from an all-time high of $15.8 to a 52-week low.
In addition, a three-week consolidation in theta price revealed a head and shoulders pattern. Besides, the price near the $1.4 neckline could provide a breakout opportunity soon. So the bulls don’t want to lose their control over the theta coin.
THETA on Weekly price chart
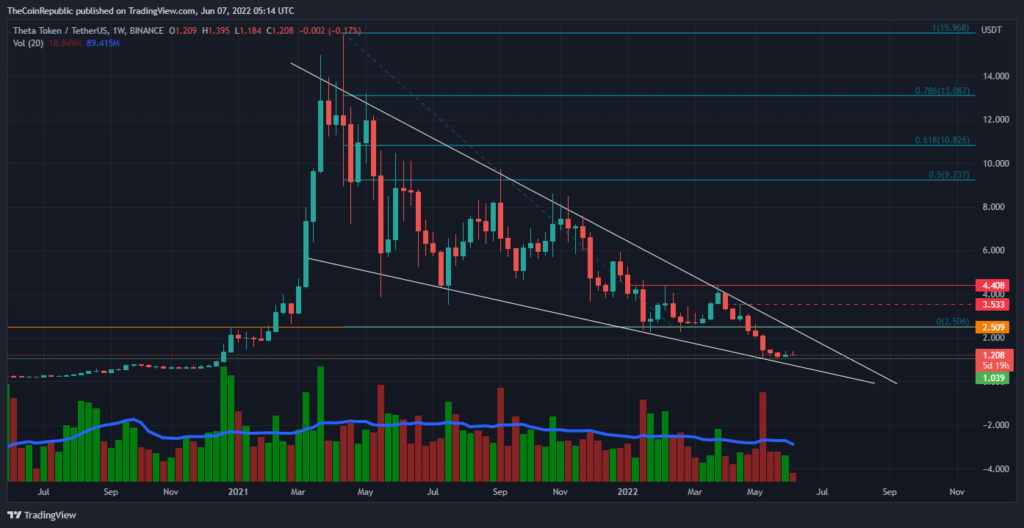
At the time of writing, Theta coin is trading at $1.2 mark with a retracement phase in the intraday trading session. The $1.0 ideological level was a pivotal support level amid a fight between the bulls and the bears.
THETA on Daily price chart
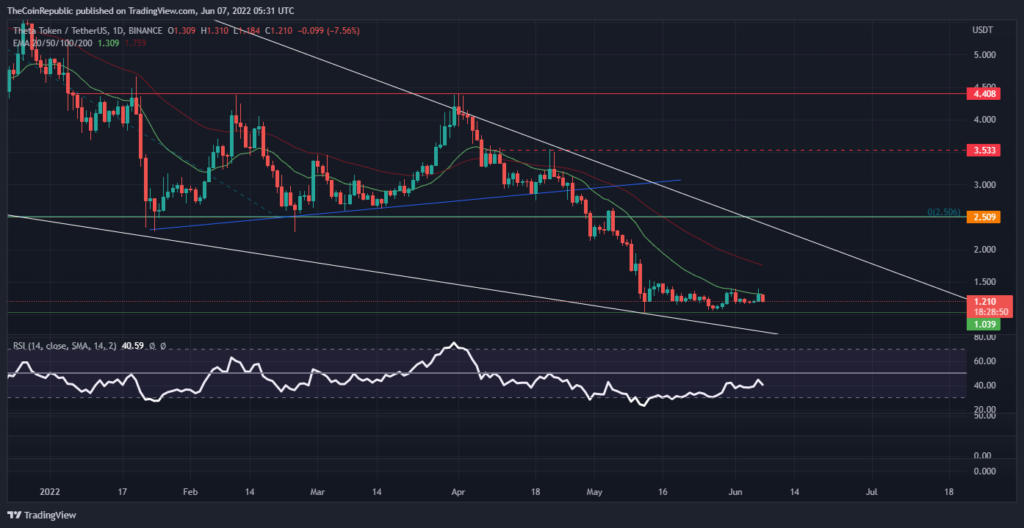
The 20-day exponential moving average acted as an important resistance area for a long time. Although the bulls have made several breakout attempts, the bears have a strong sell zone near this horizontal resistance.
Meanwhile, Theta’s market cap fell nearly 10% over the past 24 hours as it stood above $1.2 billion, according to CMC. Furthermore, Theta coin is down 4.2% at 0.000044039 satoshis and the bitcoin pair.
Trading volume shows low volatility in Theta coin, but last night’s bulls looked aggressive for Bullish Momentum, so trading volume jumped around 55%. But still low liquidation remains in altcoin price.
Between Pump and Dump, the RSI indicator favors the buyers as it is moving towards the semi-line (50 points), but the confirmed trend will execute above 50 points.
Conclusion
Theta Network coin is trading at its lowest level, so buyers have an opportunity to push the asset price towards the most recent resistance of $1.5 to enter a trend reversal indicator.
Resistance level- $1.5 and $2.0
Support level- $1.0
Disclaimer
The views and opinions stated by the author, or any people named in this article, are for informational ideas only, and they do not establish the financial, investment, or other advice. Investing in or trading crypto assets comes with a risk of financial loss.