Universal High Income
 Axis Robotics
 Pearl
 Aerodrome Finance
 Pudgy Penguins
 Zcash
 Quantus

- Litecoin price became trapped in a descending wedge pattern on the daily price chart, forming a new monthly low.
- During the downtrend, LTC coin has been stuck between the lower range of the Bollinger Bands indicator and the semi-line for the past 10 days.
- Litecoin is trading with a pair of Bitcoin with a decline of 2% at 0.002027 satoshis.
Litecoin is under selling pressure as price action remains in a descending wedge pattern on the daily price chart. Look at the previous data, each decline occurred after spending a period of time between bearish patterns such as falling patterns. Similar happened in April, where the bulls struggled to maintain the bullish trend, but they witnessed a scary downtrend.
Amid a lower-high formation, LTC price is retesting the lows of the following bearish pattern and another bloodbath is expected if the price slides below this support line, which will take the downtrend to an annual low. can go.
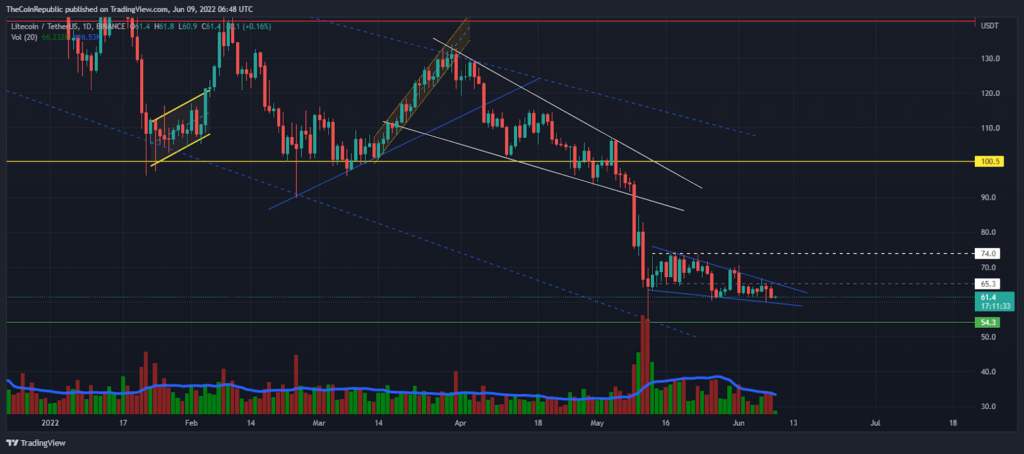
The bulls are battling a sideways trend in the intraday trading session after a sharp fall last night. Thus, at the time of writing, Litecoin is trading at the $61.5 mark, where the short-term support level for the bulls is near the $60 mark.
Meanwhile, the market cap has fallen 2% to $4.3 billion in the past 24 hours according to the CMC. Furthermore, Litecoin is trading with a pair of 2% at 0.002027 satoshis for bitcoin.
LTC is retesting lower-range of Bollinger Bands indicator
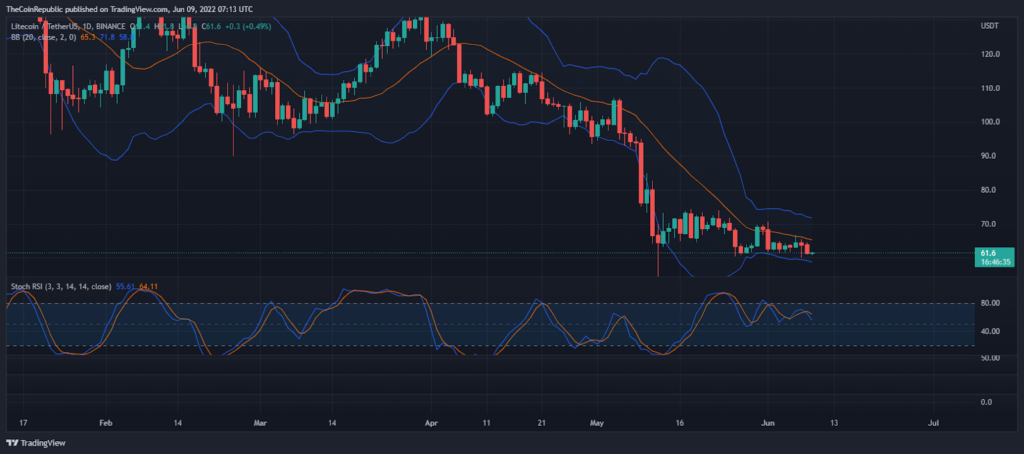
In terms of the daily price scale, for the past 10 days, LTC price has been stuck between the lower boundary of the Bollinger Bands indicator and the semi-line (resistance zone). If the price breaks this bullish barrier, buyers can target the $70 mark as a short-term target.
But Stoch RSI is forming a low-high formation after retreating from the overvalued zone.
Conclusion
Stoch RSI could be a signal behind Litecoin’s downtrend. If the price breaks below the support line of the declining wedge pattern, another bloodbath could occur again.
Support level – $60 and $50
Resistance level – $70 and $100
Disclaimer
The views and opinions stated by the author, or any people named in this article, are for informational ideas only, and they do not establish financial, investment, or other advice. Investing in or trading crypto assets comes with a risk of financial loss.