Covenant x402
 Tetsuo Super Intelligence
 Doge Pepe
 hi
 Pudgy Penguins
 Quantus
 Pearl

- Zilliqa price is trying to gain uptrend momentum over the daily price chart.
- ZIL Crypto has recovered till 20 EMA and is still below 50, 100 and 200-days Daily Moving Average.
- The pair of ZIL/BTC is at 0.000001853 BTC with an intraday drop of 0.13%.
Zilliqa price has been trying to break out of the consolidation phase, but bulls have repeatedly failed to hold gains at the threshold of the consolidation phase. Positive feeling toward ZIL shows that they are now concentrating on recording the token’s breakaway from the horizontal range. However, the token’s cost has remained constant from $0.034 to $0.050. The price of ZIL is currently ascending into the top range of the consolidation phase and is in a strong uptrend. To enable the token to move above the caged area, ZIL bulls must maintain their position at the trendline.
Zilliqa’s estimated price is currently $0.039; its market value has increased by 0.72% over the previous day. During the intraday trading session, there were 20.40% fewer trades than usual. This would mean that bears are attempting to hoard in anticipation of the ZIL cryptocurrency’s price drop. Volume to market cap ratio is 0.3539.
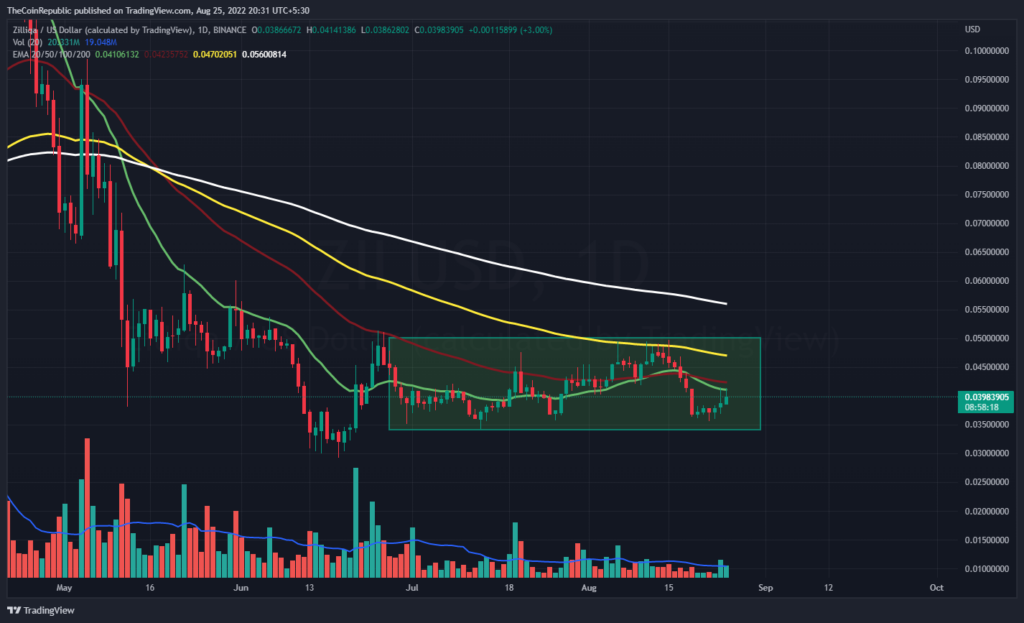
On the daily price chart, ZIL’s price is moving upward toward the upper trendline of the consolidation phase. To see the breakout of the token, bulls must gather at ZIL. Bears, however, could at any time halt the ZIL coin’s upward momentum because volume indicates that the rate of accumulation is minimal. If bulls in ZIL wish to avoid getting caught in any bearish traps, they must accumulate quickly.
What do Technical Indicators suggest about ZIL Crypto?
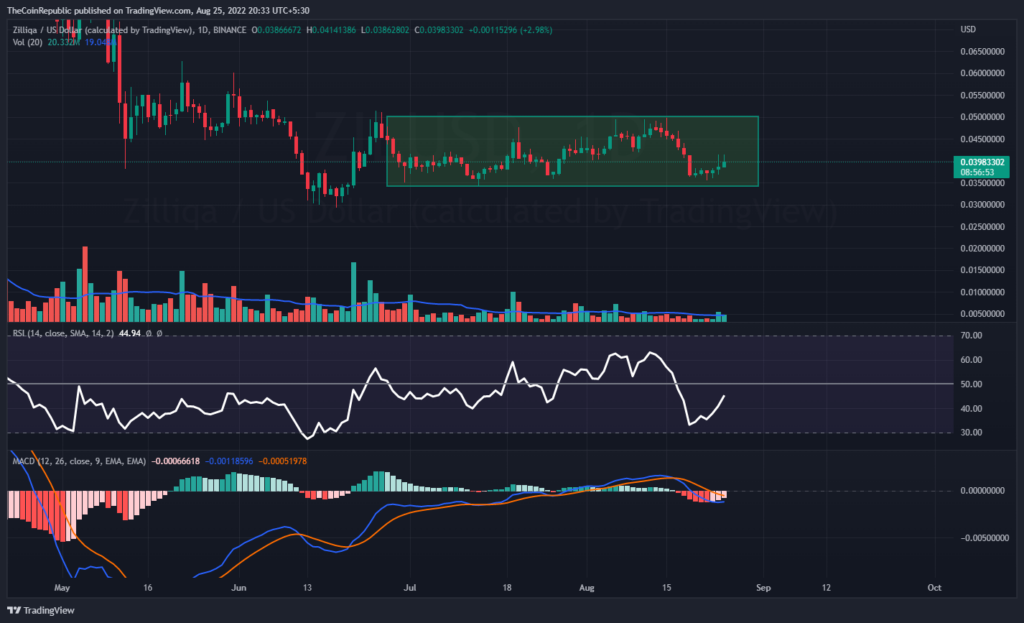
On the daily chart, the ZIL coin price is attempting to hold at the present level during the consolidation phase. Technical indicators point to the momentum of the uptrend for the ZIL currency.
The ZIL coin’s upward momentum is displayed by the relative strength index. RSI is 44 and moving in the direction of neutrality. The ZIL coin’s positive momentum is visible on MACD. A positive crossover between the MACD and signal lines is about to occur. Investors in ZIL must watch the daily chart for any directional changes.
Conclusion
Zilliqa price has been trying to break out of the consolidation phase, but bulls have repeatedly failed to hold gains at the threshold of the consolidation phase. Positive feeling toward ZIL shows that they are now concentrating on recording the token’s breakaway from the horizontal range. However, the token’s cost has remained constant from $0.034 to $0.050. The price of ZIL is currently ascending into the top range of the consolidation phase and is in a strong uptrend. Bears, however, could at any time halt the ZIL coin’s upward momentum because volume indicates that the rate of accumulation is minimal. Technical indicators point to the momentum of the uptrend for the ZIL currency. A positive crossover between the MACD and signal lines is about to occur. Investors in ZIL must watch the daily chart for any directional changes.
Technical Levels
Support Levels: $0.035
Resistance Levels: $0.045
Disclaimer
The views and opinions stated by the author, or any people named in this article, are for informational ideas only, and they do not establish the financial, investment, or other advice. Investing in or trading crypto assets comes with a risk of financial loss.