
 Quack AI
 Bitcoin
 Lighter
 Injective
 Pearl
Pearl Zcash
Zcash Sui
Sui
- SOFI stock price fell 12% on a single day after quarterly earnings.
- Sofi stock gets rejected from 200 day EMA and trading near to 52 week low.
- SOFI Technologies (NASDAQ: SOFI) reported quarterly earnings on May 9, 2023.
SOFI stock price fell 12% on a single day after the release of quarterly earnings despite meeting the analyst estimates. It indicates short term investors and traders have booked their profit and exited on the higher levels.
The price is in a downtrend and slipping down by forming lower low swings. The downfall eroded the returns generated in the past few months and prices are approaching the 52 week low.
SOFI stock price gets rejected from the 200 day EMA and also dropped below the 50 day EMA. It indicates the short term trend has also reversed in the downward direction. Recently, the stock witnessed a massive spike in the selling volume due to earnings which hurted the sentiment of the long term investors.
SOFI Technologies (NASDAQ: SOFI) released quarterly earnings on May 1, 2023. It reported EPS of -$0.05 vs estimates are -$0.08. Reported revenue of $460.163 Million vs estimates are $440.574 Million. Company performed well in the earnings but still investors chose to sell the stock. Therefore it will be interesting to see, Is the recent down temporary or the damage going to stay for a long time.
Will SOFI stock retest the 52 week low?
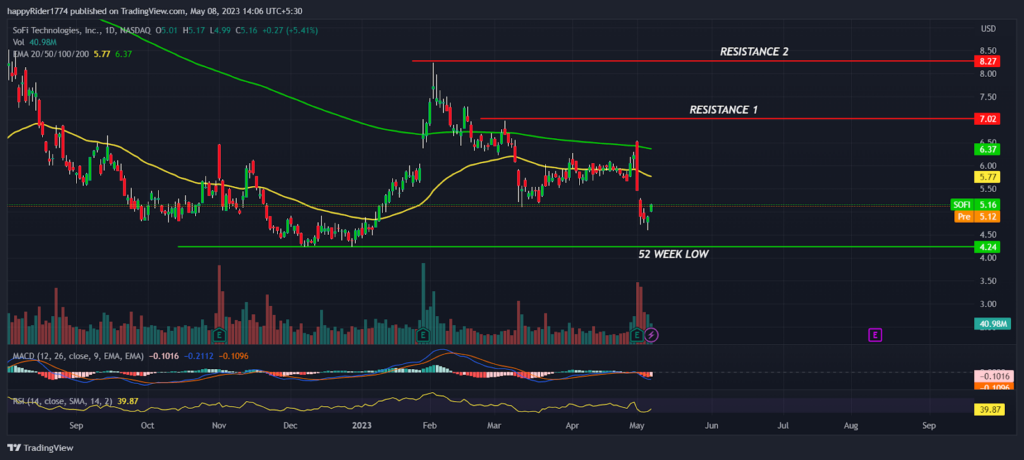
SOFI stock price once attempted to break out of the $8.00 hurdle but sadly the attempt failed. It formed a long tail bearish candle and prices began to decline by forming lower lows.
Slowly and steadily, SOFI stock dropped below both the EMAs which invited further decline. Later prices consolidated for a few weeks in a hope of a bullish trend reversal but the recent collapse broke the lower range. However, the prices seem to be in oversold territory and might consolidate for some time before deciding the further direction.
If the buyers succeed to defend the $4.24 then the probability of rebound will increase. However, the price will pick up momentum only after breakout of $7.00 hurdle. The technical analysis suggests the recent fall in SOFI stock is temporary and prices are likely to consolidate near yearly lows for base formation.
Sofi Stock price: Technical outlook
Sofi stock price is down by 17% in the current week and forming a bearish candle. The downfall has strong momentum and might test the 52 week low again. However, the broader market index like Dow Jones and Nasdaq is bullish which might positively impact the sentiment of the investors.
The technical indicators like MACD had generated negative crossover but the curve is reversing upward. It shows bears are lacking momentum. The RSI at 39 reversing upward from the oversold territory and might try to test the neutral zone.
Conclusion
SOFI stock price fell 12% on a single day and reacted negatively after quarterly earnings. The price is approaching the 52 week low which will act as strong support for the long term investors. The technical analysis suggests the recent downfall in NASDAQ: SOFI stock is temporary and possibility of rebound from 52 week low is high.
Technical levels
Resistance levels : $7.00 and $8.00
Support levels : $4.24 and $4.00
Disclaimer
The views and opinions stated by the author, or any people named in this article, are for informational purposes only. They do not establish financial, investment, or other advice. Investing in or trading crypto assets comes with a risk of financial loss.




