
 Boomer
 Minter
 Pearl
Pearl Pudgy Penguins
 Sui
Sui Covenant x402
 Pump.fun
- TWT token slips below 20 EMA and shows bearishness on the daily chart.
- Buyers are losing momentum and trying to hold gains.
Trust Wallet Token is looking in a narrow range but gradually slipping the gains in the recent trading sessions. However, the token does show any decisive moves on either side and remains in the congestion zone. At the same time, the sellers are looking aggressive in the last trading session showing addition in short positions.
TWT token is trading below the significant moving average and showing bearish cues. Moreover, the recent price action shows a double bottom chart pattern, but a bounce from the support mark of $1.1000 is needed to attain neutrality.
Trust Wallet token is forming a shooting star and inverted hammer candlestick, which shows that buyers cannot stay on the top of the consolidation range and face rejection and showing reversal on the charts.
When writing, TWT price is trading at $1.1139 with an intraday massive drop of 3.30%, showing long unwinding moves. However, the trading volume is noted at $2.52M. The token has a market cap of $466M.
Daily Charts Shows Consolidating Moves
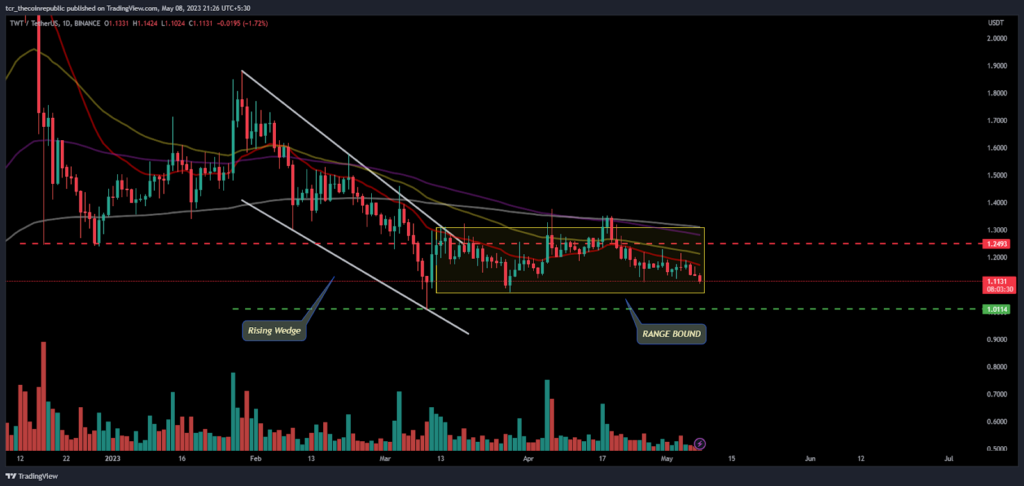
On the daily chart, after the down move in the past month, the TWT token stayed in the narrow range and traded with low volumes. Furthermore, seller control was noted in the token moves rather than buying actions. Although the token did not show any significant upside or downside, it remained in a narrow range, offering that price got stuck in a small territory. The chart shows a rising wedge pattern with the target upside near the trajectory targets of $1.5000. If the token starts to attain momentum and trade above 20-day EMA, then momentum arises, and buyers will try to move out of the range and show their aggressive muscles.
Short term charts of TWT token
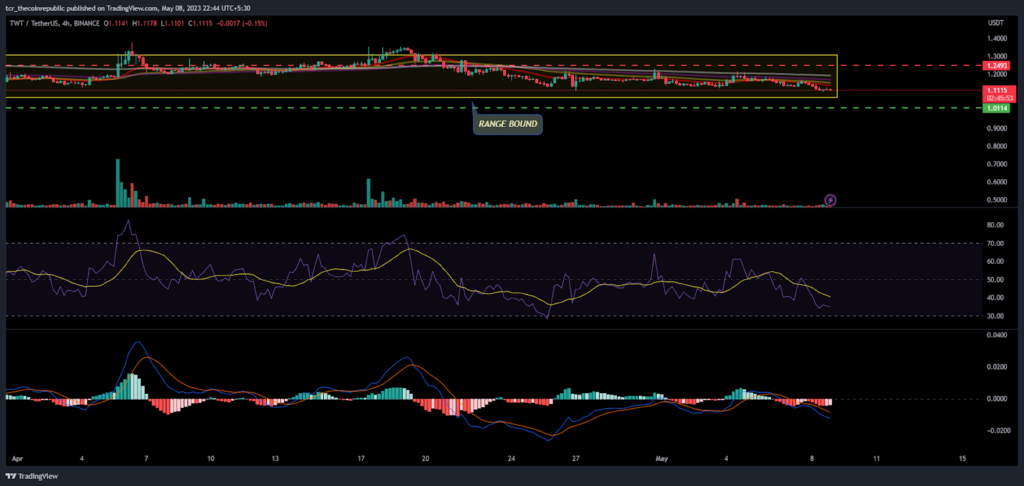
On the 4-hour chart, the TWT token shows a price dip with a bearish candlestick formed in the last trading session. The RSI is guiding towards oversold territory, and a negative crossover was noted on the index.
Moreover, the buyers tried multiple times to escape the congestion zone but failed to register; the TWT token on the technical indicators did not indicate any buying scenario for new investors but favored sellers to make short additions. Moreover, investors have to keep an eye on either breakdown or bounce to make fresh positions.
The MACD indicator still shows bearishness as the crossover steers on the curve. The negative outlook was floated based on traditional indicators and not suggesting fresh positions.
Conclusion:
Trust Wallet Token price is below the multiple EMA and trading in a congestion zone, with buyers trying to attempt a bounce.
Technical Levels:
Support Levels: $1.0500
Resistance Levels: $1.2000
Disclaimer
The views and opinions stated by the author, or any people named in this article, are for informational purposes only and do not establish financial, investment, or other advice. Investing in or trading crypto assets comes with a risk of financial loss.




