
 Zylo Ecosystem
 Walrus
 Bitcoin
 Sui
Sui Quantus
 Quant
Quant Starknet
- ZEC shows a breakdown below $30 shows selling pressure.
- Bulls are hopeless and losing gains from the last sessions.
ZCash (ZEC) is a fully anonymous and decentralized blockchain and cryptocurrency. Transactions on its proof of work blockchain are untraceable because of zero-knowledge cryptography.
ZEC coin price action was in the correction phase in the last few months and fell below the support mark of $30. The bearish cycle of the ZEC coin was not stopped till now and continues to retest the lower mark.
Moreover, the price action showed that bulls attained momentum in the last session and tried to gain traction.However, multiple resistance marks were faced by ZEC in the past trading sessions and unable to go beyond the boundaries.
The ongoing price action delivers a negative outlook and shows cautious move of the token indicates selling pressure in the token.
Recently, ZEC showed a double bottom and falling wedge chart patterns on the daily charts, but bulls unable to lead on the front and soon sellers’ attachment of the token will lead to selling in the token.
When writing, ZEC coin trades at $25.23 with an intraday gain of 2.46%, showing buyers putting efforts in the last trading session. Moreover, the pair of ZEC/BTC is at 0.000977 BTC and the intraday trading volume was increased by 5.50% to $26.73 Million. The intraday high of ZEC is $25.78 and the low of $24.54 shows decent moves in the coin. The market cap of ZEC is $398.89 Million.
Daily Charts of ZEC coin
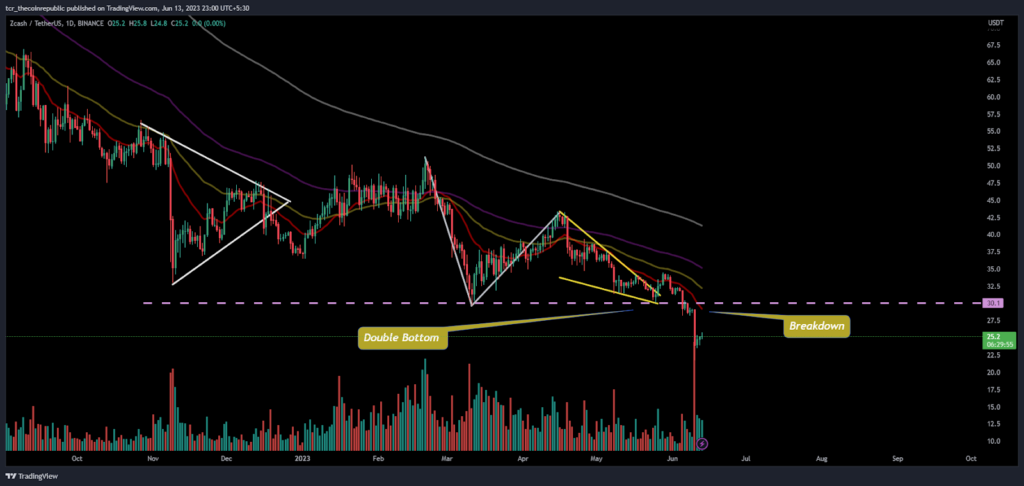
On the daily charts, ZEC coin showed an intraday gain but bulls did not look capable to reverse the trend and led the further gains due to the sentimental negative impact and downward trend of ZEC. Although bulls gained traction in the last session and are trying to indulge the gains further.
However, there is a need for further rise in momentum above the neckline of $30 and $35 to be cleared first to extend the gains and form a higher low after the reversal. Furthermore, the downtrend is still there because sellers were not exiting their short positions and trying to drop the bulls pace of action further.
Short Term View of ZEC
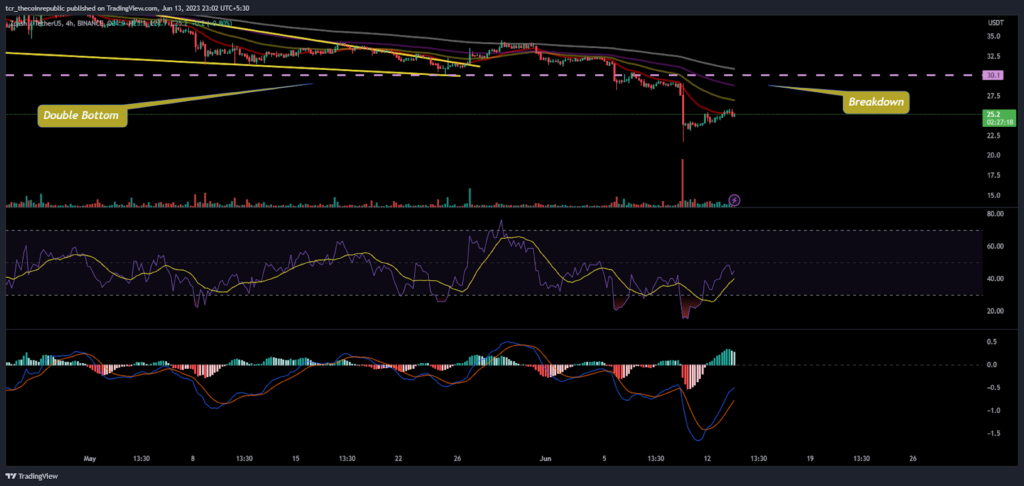
On the 4-hour charts, ZEC shows positive cues with a reversal move on the leading indicators offering an extensive move. Furthermore, the technical parameters are indicating a rise of a trend from there as the correction was now looking to an end.
The RSI showed reversal from the oversold region and a positive crossover was noted on the charts. Moreover, the curve shows a rise in bulls’ momentum, deriving a trend reversal move.
The MACD curve shows a rise in green bars on the histogram showing a bullish crossover and the positive cues of the ZEC coin.
Conclusion:
ZEC token is looking to end the era of correction and is willing to attain strength to gain neutrality in the upcoming sessions.
Technical levels
Support levels: $20
Resistance levels: $35
Disclaimer
The views and opinions stated by the author, or any people named in this article, are for informational purposes only. They do not establish financial, investment, or other advice. Investing in or trading crypto assets comes with a risk of financial loss.




