
 Injective
 Pudgy Penguins
 Quantus
 Bitcoin
 Celestia
 Sui
Sui Derive
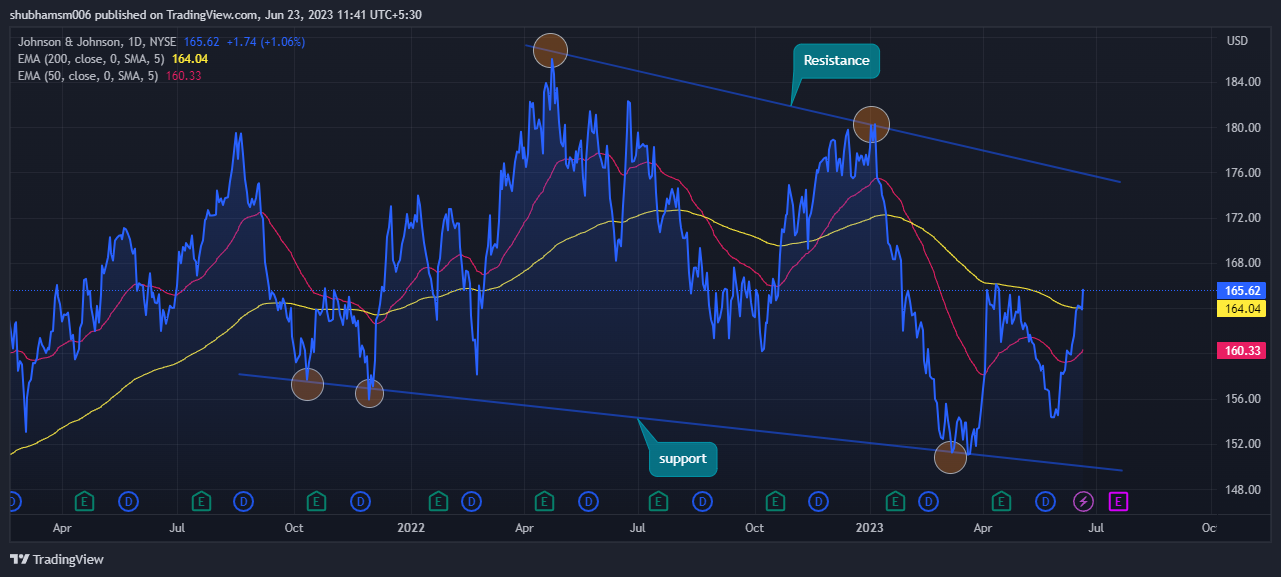
- Johnson & Johnson (JNJ) is trading at $165.62 with a minor rise of 1.06% in the previous trading session.
- Johnson & Johnson’s 52-week price range is 150.11-183.35.
- The JNJ market capitalization is 430.40 Billion.
Introduction
Johnson & Johnson is a huge pharmaceutical, consumer packaged items company with a global presence. Johnson &Johnson has a wide product range. JNJ sold its products in more than 175 countries. We all know that JNJ has huge growth opportunities in the pharmaceutical field. JNJ gives consistent returns to their investors over the period. JNJ is a reliable company with excellent fundamentals and strong profit records.
Trend Evaluation
By evaluating the price data of the JNJ Stock, it can be said that it is in an uptrend currently. The profit margin of the stock is 13.22%. We can say that JNJ is performing well right now. From its 52-week bottom price of $150.11, it increased to a $183.35 peak price. The JNJ stock gives some excellent returns to investors. The current market sentiments are very positive about the stock. The average 3 months volume in JNJ is $6.83 Million. Buyers are showing interest in the stock in the present market scenario.
Johnson & Johnson (JNJ) Technical Analysis
The price of JNJ has slipped above 50 and 200 EMA, which suggests that the price is in a bullish trend. The stock could grow more in value in the upcoming week. If the buyers continue to push the price upwards, it will grow more. The price is consolidating near 200 days and 50 days EMA and then breaking it, which shows that bulls are back in control.
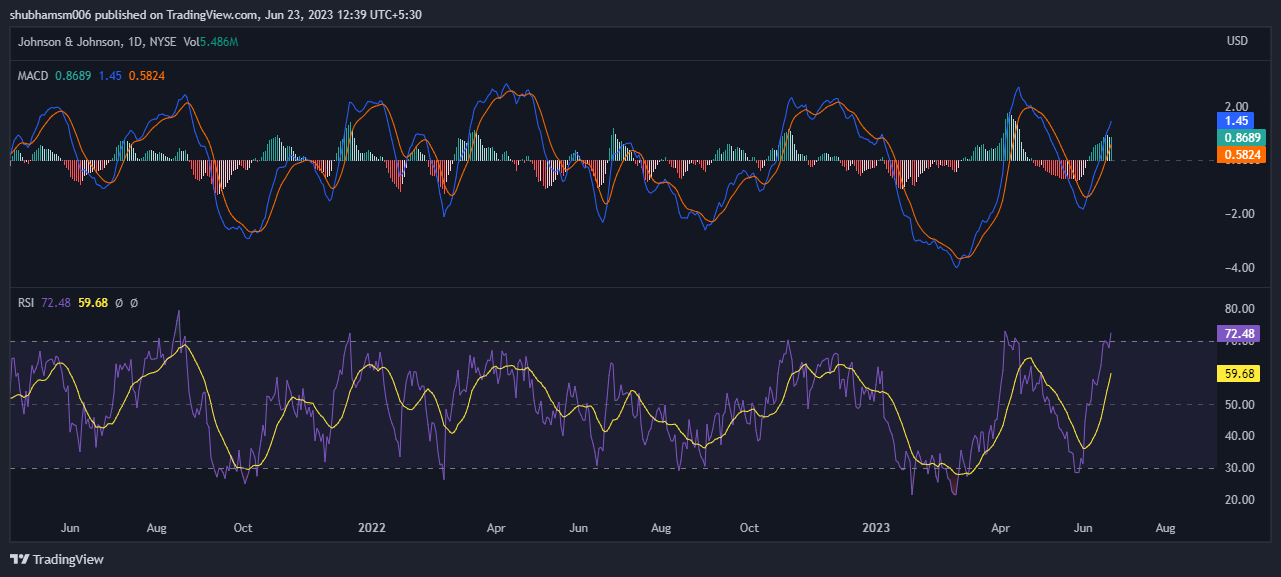
The technical indicator MACD is also in the positive zone. The MACD line at 1.45 and signal line at 0.5824 is above the zero line, suggesting the MACD is in positive territory and giving bullish signals.
The current value of RSI is 72.48 points, and the 14 SMA line is currently below the median line, around 59.68 points which show bullish sentiment in the market. The 14 Day SMA line above the median line indicates a bullish trend. The bullish sentiment spreads around the market as the price is currently in an overbought zone.
Trendline Analysis: The price has respected its significant trendline support, and it is going toward a resistance of $175.30. If the price breaks the trendline, then it will go up to the next resistance level. If the price gets rejected by the resistance, then it will come back to the current support.
Volume Analysis: There is a substantial boost in the volume of the stock. The average 3 months volume of Johnson & Johnson (JNJ) is $6.83 Million.
Summary
Johnson & Johnson (JNJ) is rising upwards in the market. The price action suggests that the price may increase more in the upcoming days if it broke its primary trendline resistance level. JNJ’s price shows an optimistic scenario at the moment. Major reliable indicators like EMA, RSI, and MACD give positive signals about JNJ Stock. The enthusiasm is growing among investors because of the excellent performance of the stock. A boost in the buying of Johnson & Johnson stocks is seen in recent days. We can say that Johnson & Johnson is for the long haul and have the potential to make a fortune for their investors. Now is the right time to invest in this stock for 2023.
Technical Levels:
Support – The current support level of JNJ is $175.30.
Resistance –The current resistance level of JNJ is $150.19.
Disclaimer
The analysis given in this article is for informational and educational use only. Do not take this information as financial or trading advice. Trading and investing contain financial risk. Before making any investment or trading decision, please consider your risk profile and circumstances.




