
 Dacity Coin
 Celestia
 Pudgy Penguins
 Injective
 Solana
 Sui
Sui Starknet
- The Nike Inc. (NYSE: NKE) stock price is trading at $109.06.
- The Nike Inc. share price has a market capitalization of $166.86 Billion.
- NKE stock gave a return of -2.29% to its investors in a year.
According to the analysis, Nike Inc.’s (NKE) stock price is currently in a downtrend and forming lower lows. The price of Nike Inc reached a high of $179.1 in November 2021 and then dropped by 54% the following year.
At $82, the price found support and then it began to rise. Additionally, the price increased to $131 before running into resistance. Multiple attempts to break through the barrier were unsuccessful and after almost three months of consolidation, the price once again began to plummet.
Nike Inc.’s (NYSE: NKE) price is forming a bad market structure. Based on the current market conditions, the stock price is likely to drop shortly. Moreover, the stock volume is declining, which could lead to a further drop.
Nike Inc. (NKE) stock has a P/E of 33.29, which is considered high. This indicates that the stock is overvalued. Additionally, the stock price of a stock might decline in the future.
The net profit of Nike stock in the last four quarters has decreased by an average of 11%.
Nike Inc. (NKE) Stock Price Analysis
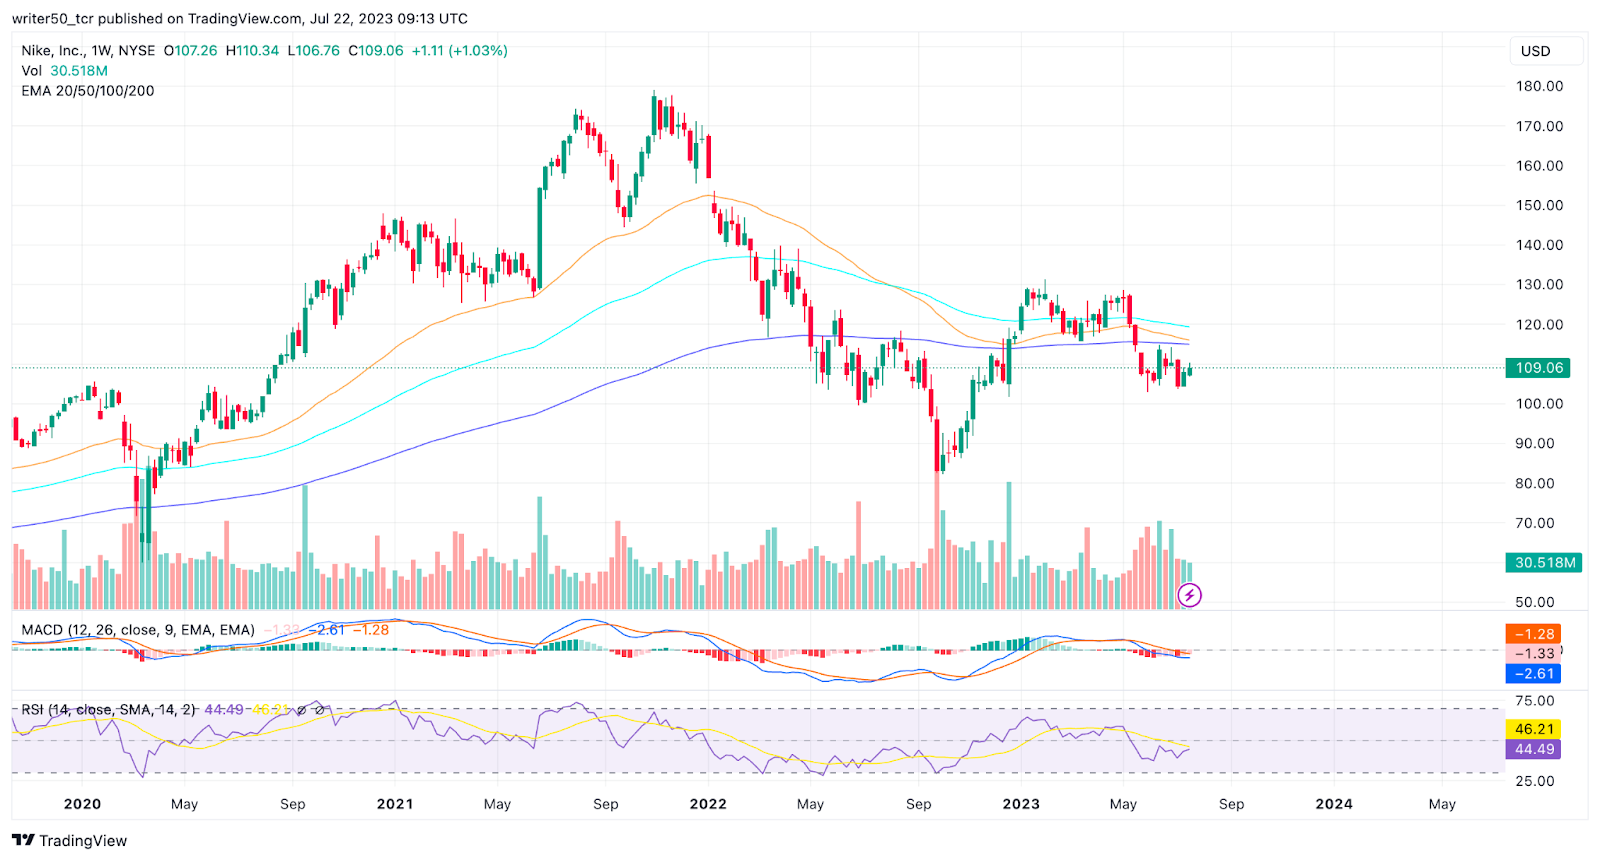
Shares of Nike Inc. are trading below their 20, 50, and 100-day Exponential Moving Averages (EMA). This is a bearish indication and may indicate that the stock is about to decrease in value.
The red histogram that represents the MACD indicator is created by the intersection of the MACD line and the signal line, which are both located below the zero line. This combination raises the possibility of a market fall.
Nike Inc. stock’s Relative Strength Index (RSI) is trading below the Simple Moving Average line. This is a negative indication for the stock and prices might fall in upcoming days.
As per the chart of Nike stock in a daily timeframe, the volume of the NKE stock is declining. This raised negative sentiments for the stock.
Conclusion
In conclusion, there are now unfavorable indicators for Nike Inc.’s stock price and further price decreases are expected soon. There is a strong indication that the stock price of Nike Inc. will decline. When taking into account the bearish MACD configuration, the lack of oversold conditions in the RSI, and the unfavorable EMA placement, it can be concluded that the stock will be showing a negative momentum.
Technical Levels
- Support Level – $103.
- Resistance Level -$128.
Disclaimer
The views and opinions of the author, or anyone named in this article, are for informational purposes only. They do not offer financial, investment, or other advice. Investing or trading crypto assets involves the risk of financial loss.




