
 streamoors
 Celestia
 IGNITION
 Injective
 Pudgy Penguins
 LayerZero
 Quantus
- The share price of Qualcomm Inc. is currently below the 50-day and 200-day exponential moving averages.
- The stock price of Qualcomm Inc. (NASDAQ: QCOM) is currently $129.48.
- The current market value of Qualcomm Inc. (QCOM) is $144.2 Billion.
The share price of Qualcomm Inc. is $129.48 with an increase of 2.88% in 24 hours. Qualcomm Incorporated, a multinational American semiconductor and telecommunications equipment company, develops and markets wireless telecommunications equipment and services. It was started back in 1985.
Qualcomm Inc. (NASDAQ: QCOM) stock price has a market capital of $144.2 Billion and an average volume of $8,860,439. The stock yields a timely dividend of 2.61%, and this can attract buyers’ attention. The first quarter revenue of QCOM is $9.28 Billion.
Qualcomm Inc.’s (NASDAQ: QCOM) stock price is currently moving in an uptrend momentum. The price of QCOM is forming a higher high pattern.
The stock price of Qualcomm Inc. (QCOM) has been on a downturn since reaching a high of $193 in January 2023 and has dramatically declined by roughly 46% during the last nine months. From the $102 support level, the stock attempted to reverse.
With excellent volume and momentum, Qualcomm’s stock is currently showing signs of breaking out of a descending triangle pattern. In the past two months, the QCOM stock price has increased by 27%.
The overall pattern and structure of the Qualcomm stock is forming a positive structure and the price is likely to rise in the upcoming days.
Qualcomm Inc. (QCOM) Stock Price Analysis
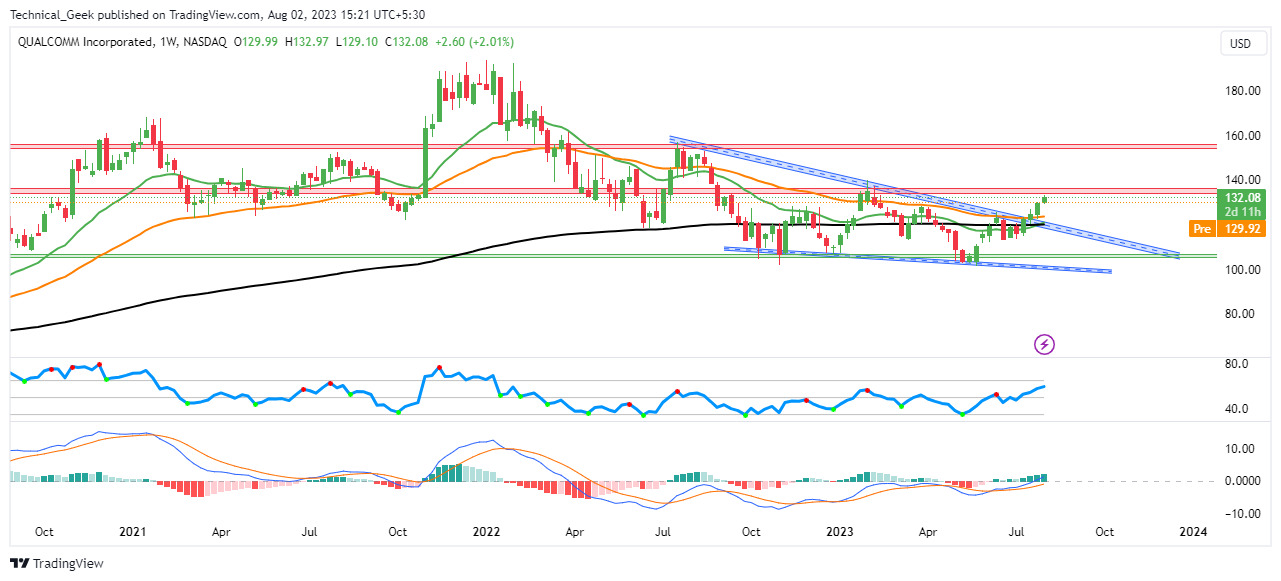
A bullish indicator for Qualcomm Inc. shares is due to the 50-day and 100-day exponential moving averages (EMA) being lower than the price.
The MACD line is above the signal line, and both lines are above the zero line, resulting in the green histogram, which is a sign of a positive outcome. A probable market rise is indicated by this setup.
The relative strength index (RSI) line for Qualcomm Inc. (QCOM) is above the SMA line, which denotes an increase of a strong trend. This provides more evidence in favor of the prediction that prices may increase soon.
Conclusion
As per the analysis, the overall trend of Qualcomm Inc. (QCOM) is in an uptrend direction and the price is forming higher highs. The breakout from the recent level and increase in volume further signify the upward momentum. The indicators are also suggesting a further upward move in the future.
Technical Levels
- Support – $102.
- Resistance – $132.
Disclaimer
The views and opinions of the author, or anyone named in this article, are for informational purposes only. They do not offer financial, investment, or other advice. Investing or trading crypto assets involves the risk of financial loss.



