
 Dacity Coin
 Pump.fun
 Pudgy Penguins
 Bitcoin
 Pearl
Pearl Monad
Monad Zcash
Zcash
- Bluzelle (BLZ) has a 24-hour trading volume of $2.8 Million.
- Bluzelle’s (BLZ) live market cap is $48.97 Million.
- BLZ coin is currently trading at $0.11.
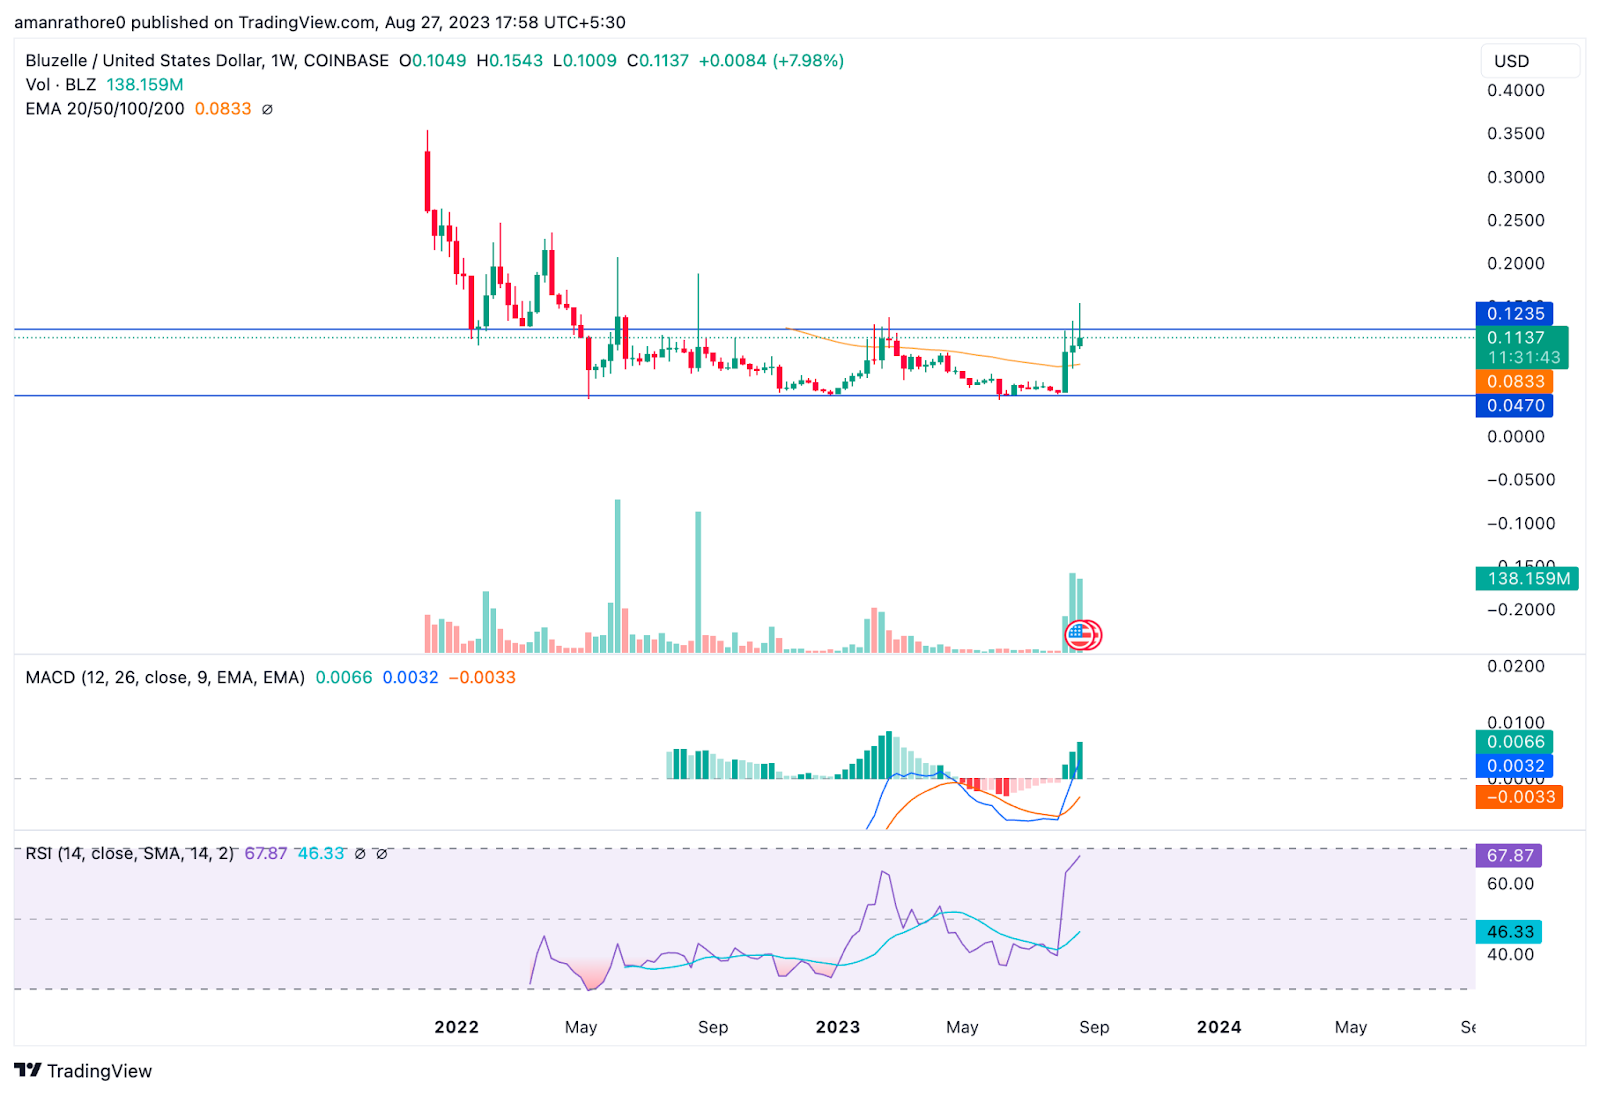
The price of the BLZ is in an uptrend momentum. The price is gaining huge momentum with a rise of 121% in one month. and BLZ is forming a higher high pattern.
Financial Data of Bluzelle (BLZ)
The open interest of the BLZ coin is $113.37 Million. The BLZ coin’s OI increased by 1.26% in the last 24 hours on 26 August 2023. The volume of the BLZ coin is 2.85 Million.
The total circulating supply is 411,903,757 BLZ and the total supply is 500,000,000 BLZ. The fully diluted valuation is $57,009,241. The BLZ coin has a market cap of $48.9 Million.
The BLZ coin has made a 52-week high of $0.15 and a 52-week low of $0.04. The Bluzelle made an all-time high of $0.91 on February 7, 2018, almost 5 years ago. After reaching the high the price fell by around 87.52%. However, the BLZ coin found support at the $0.04 level and the price rebounded from there.
Currently, the price is moving in a narrow range and it forms a positive structure. The price is likely to rise in the upcoming days.
Bluzelle (BLZ) Technical Analysis
EMA
Bluzelle’s price is strong. The BLZ price is trading above the 50-day and 100-day EMA levels. This is a bullish sign and shows that the price will rise.
MACD
The MACD line for the BLZ coin is trading above the signal line. Also, there is a green histogram formation in the BLZ coin. This suggests that the coin is bullish and the prices may rise in the next few days.
RSI
The RSI line and SMA line for BLZ coin are currently trading near the 70 level. This is a positive sign. The price of BLZ is likely to rise in the upcoming days.
Technical Indicators Summary of Bluzelle (BLZ)
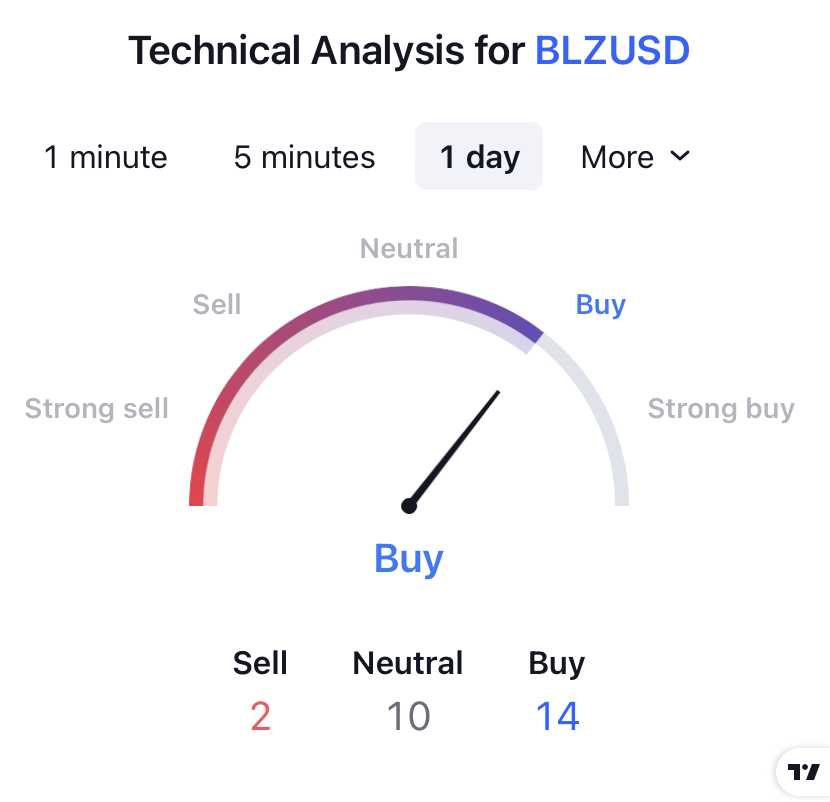
The technical summary represents the rise of bullishness in the BLZ coin. In the daily time, out of 26 indicators, 2 are showing bearish moves and 14 are showing bullishness.
Conclusion
As per the analysis, the price of Bluzelle (BLZ) is moving in an uptrend. The price is forming a positive structure. The gain in volume is easily identifiable in the charts. Also, the indicators give a positive signal.
Therefore, it is highly likely that the price will rise in the future.
Technical Levels
- Support Level: $0.4
- Resistance Level: $0.12
Disclaimer
The views and opinions of the author, or anyone named in this article, are for informational purposes only. They do not offer financial, investment, or other advice. Investing or trading crypto assets involves the risk of financial loss.




