
 Quack AI
 Pudgy Penguins
 Starknet
 Pearl
Pearl Sui
Sui Celestia
 Quantus
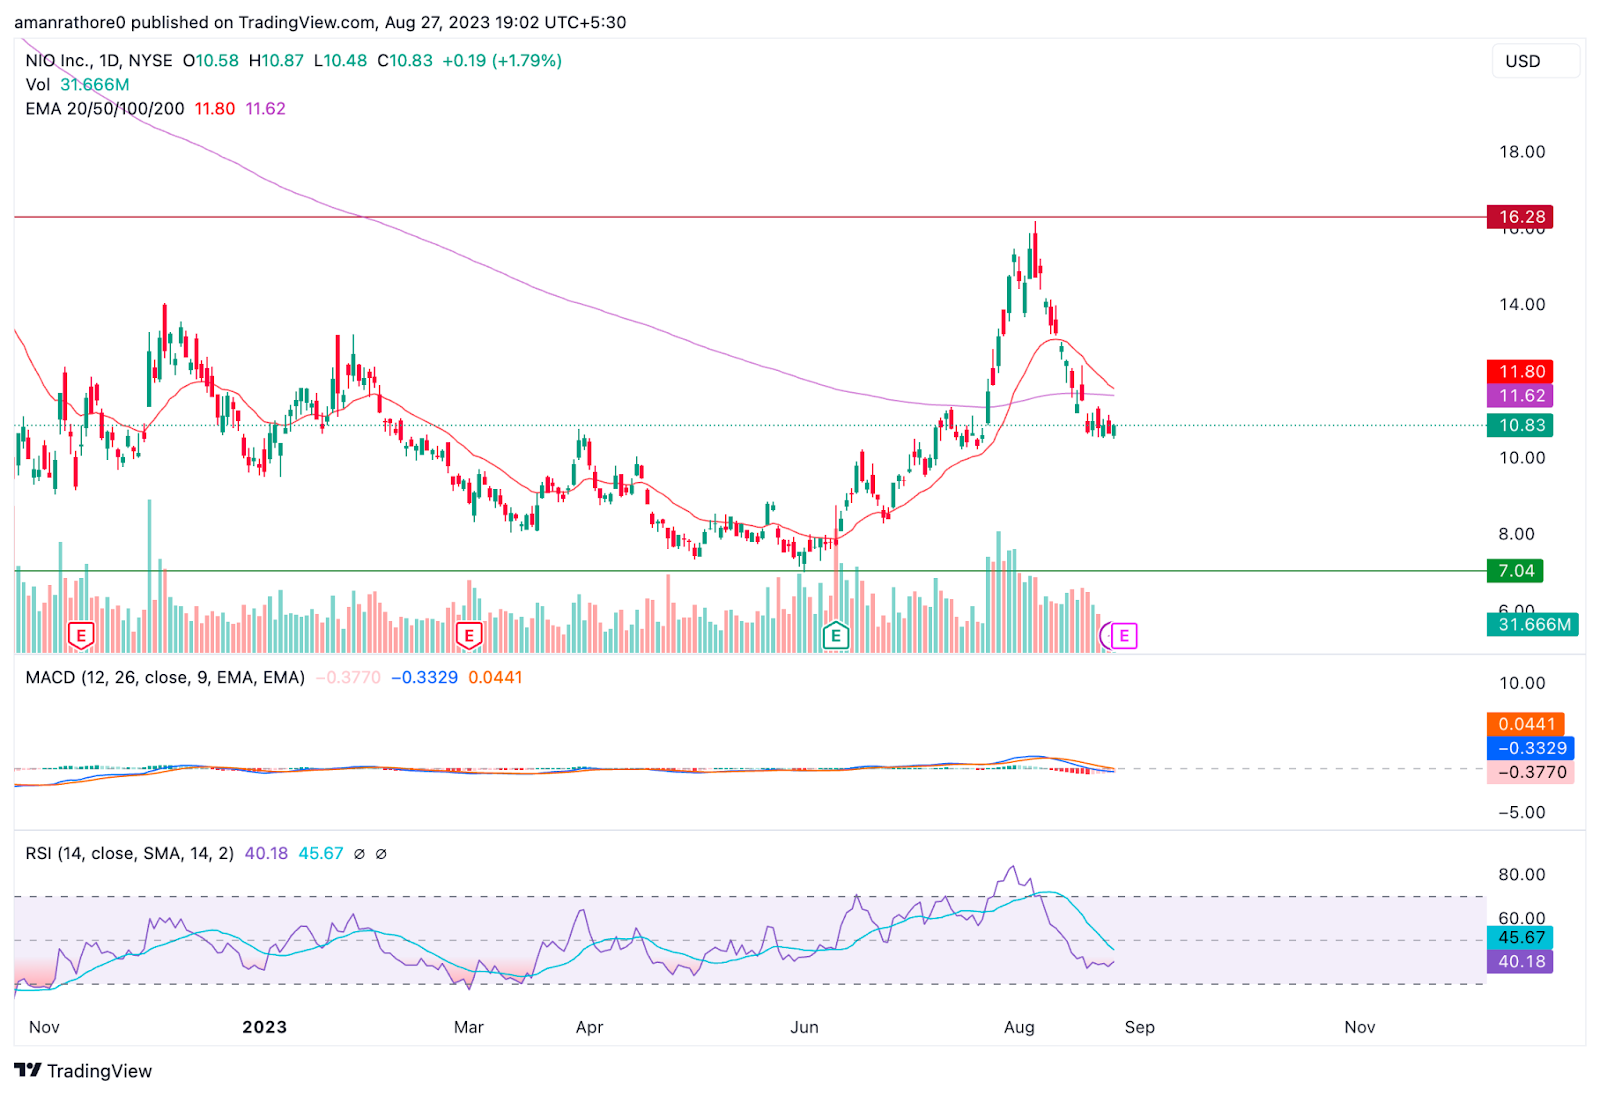
- Nio Inc.’s stock price is trading below the 50-day and 100-day EMA levels.
- The stock’s current market price is $10.8.
- Nio Inc. (NYSE: NIO) stock has a market capitalization of $16.52 Billion.
Nio Inc. (NIO) is trading in a downtrend direction. In the weekly time frame, the price of the Nio stock is declining and the price is forming a lower-low pattern.
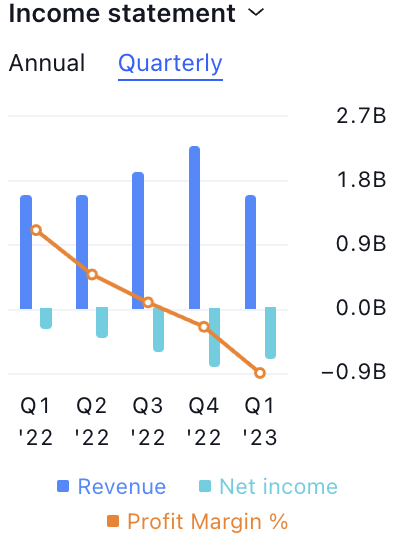
As per the data, the quarterly profit of the Nio Inc. stock is decreasing along with the quarterly net income of the company
The market capitalization of Nio Inc. stock is $16.52 Billion with a revenue of $7.62 Billion. The beta for the stock is 1.28. The 52-week high and low of Nio Inc. (NIO) shares are $22.74 and $7.0, respectively.
In the last two quarters, Nio Inc.’s revenue has dropped from $13 Billion to $10.57 Billion. The revenue declines on average by 17.9% every quarter.
The share price of Nio Inc. climbed to the high of $66.9 on 17 January 2021. The price has been in a downtrend since then. The price has decreased by 89.35%. As of now, the price is forming a weak structure.
The Nio Inc. stock price is currently moving in a small range. The volume of the pricing has decreased. The stock is developing a weak structure.
The shareholder of NIO stock doesn’t receive any dividends. Also, the NIO stock has decreased by 44% in the previous year.
Nio Inc. (NIO) Technical Analysis
EMA
The stock price of Nio Inc. is trading below both the 50-day and 100-day EMA levels. This indicates that the Nio Inc. stock is in a downward momentum and a future price decrease is possible.
MACD
The Nio Inc. stock’s MACD line is trading below the signal line. The NIO stock is forming a red histogram. This means that the stock is currently in a bearish momentum and future price drops may occur.
RSI
The NIO Inc, RSI line is trading below the 14 SMA level. Also, both of these lines are trading below the 30 level. The NIO stock’s weak RSI line indicates a possible decline in price.
Conclusion
The analysis shows that Nio Inc. stock is falling. Since last year, the price has fallen by almost 44.45%. The NIO stock volume is decreasing. Also, the indicators are giving a bearish outlook.
Therefore, a further decline in price is expected i the upcoming future.
Technical Levels
- Support Level: $7.04
- Resistance Level: $16.28
Disclaimer
The views and opinions of the author, or anyone named in this article, are for informational purposes only. They do not offer financial, investment, or other advice. Investing or trading crypto assets involves the risk of financial loss.




