
 Pearl
Pearl Ondo
Ondo Starknet
 Quantus
 Aerodrome Finance
 Pudgy Penguins
 Akash Network
- EVgo Inc. (EVGO) stock has a P/E of -1.07.
- The live market cap of $1.20 Billion.
- EVGO has an average 24-hour volume of $1.99 Million.
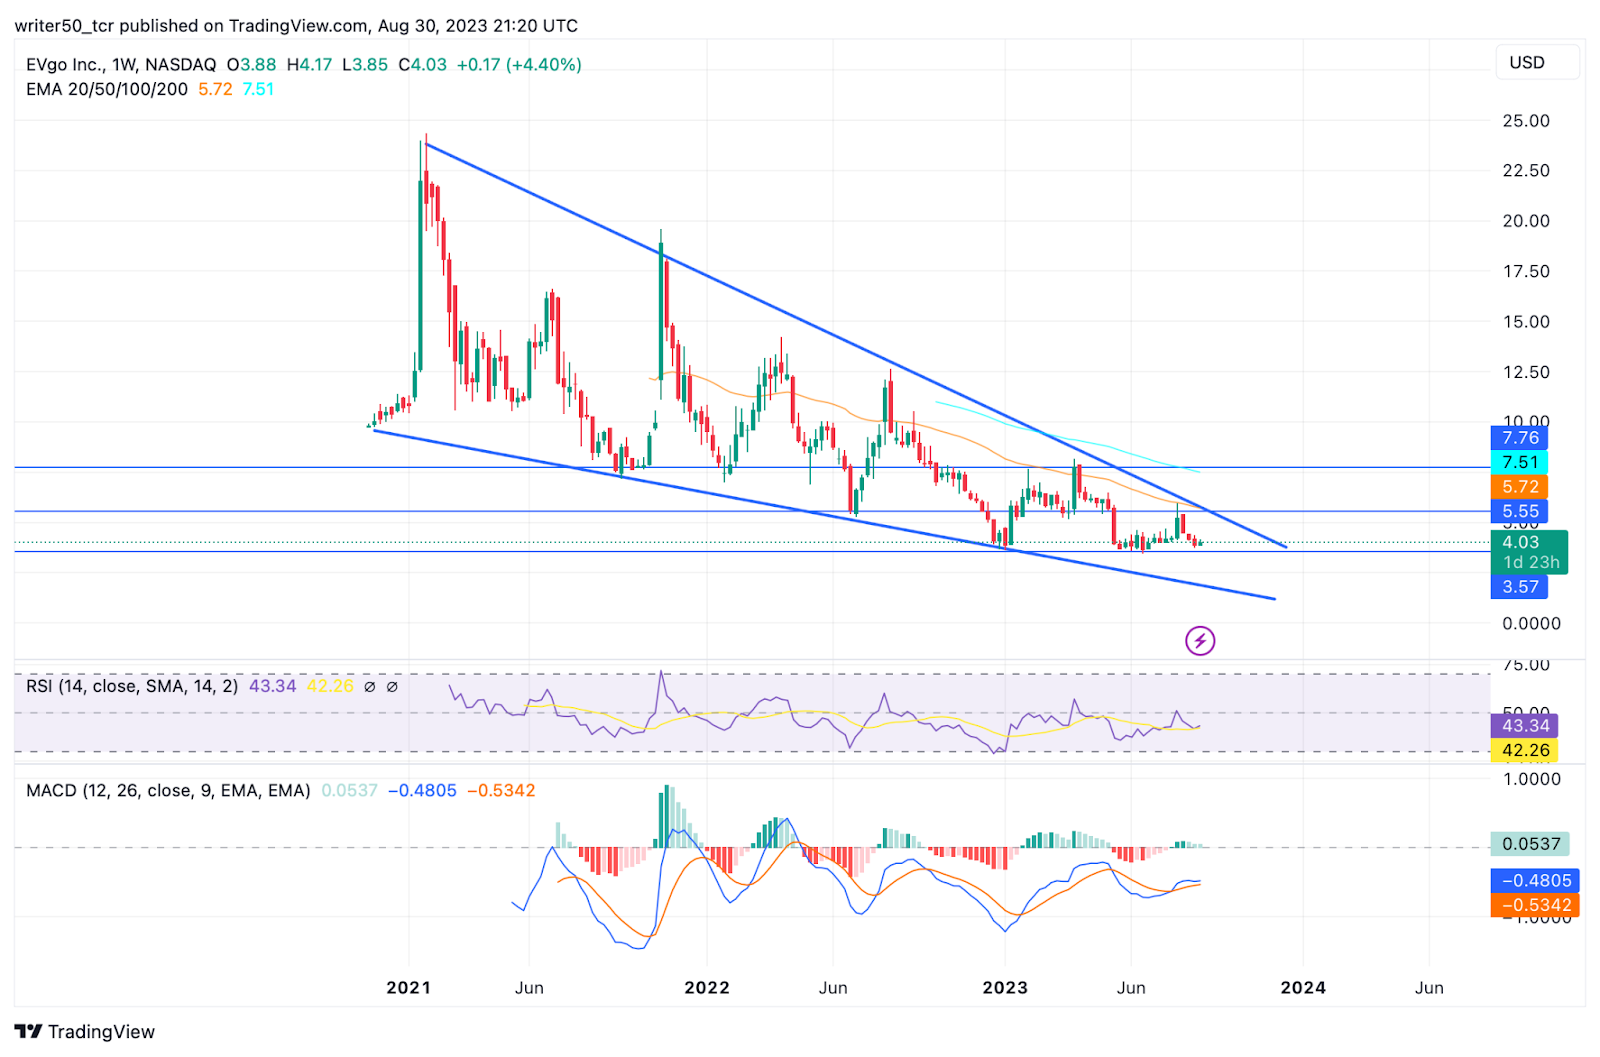
EVgo Inc.’s stock price is currently moving in a downward momentum. The price is moving in an ascending triangle pattern now. This structure demonstrates that the EVGO price is forming a negative structure and the price is likely to decline in the upcoming days.
Financial Data of EVgo Inc. (NASDAQ: EVGO)
The current market price of EVGO is $4.03. The market cap of EVGO is $1.20 Billion. The beta of EVGO is 1.5 and an EPS of -$0.50 per share.
The EVGO stock does not pay dividends to its shareholders. This can be a negative factor for the stock price and shareholders might show less interest in making a fresh position.
The EVGO stock has made a 52-week high of $10.55 and a 52-week low of $3.45. The average volume of the EVGO stock is $1.99 Million.
The price of EVgo Inc. fell by almost 32% in the last 6 months. This shows that the stock has been performing poorly in the last year.
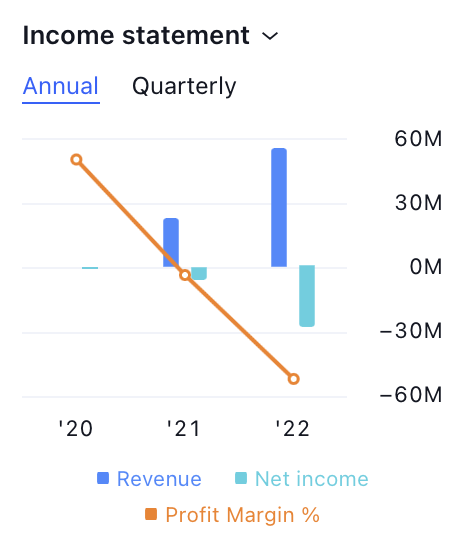
The profit margin of the EVGO stock is declining in 2023. The net income of the EVGO stock has also declined by a huge percentage.
The EVGO stock has a P/E ratio of -1.07 and the shares float of the EVgo is 96.08 Million.
EVgo Inc. (EVGO) Technical Analysis
EMA
EVgo Inc.’s stock price is weak. The EVGO price is trading below the 50-day and 100-day EMA levels. This is a bearish sign and shows that the EVGO price will fall.
MACD
The MACD line for the EVGO stock is trading below the signal line. Also, there is a red histogram formation in the stock. This suggests that the EVGO stock is bearish and prices may fall in the next few days.
RSI
The RSI line of the EVGO stock is currently trading below the SMA line. Both the lines are closer to the 30 level. This is a negative zone and further indicates that the EVGO price might decline in the upcoming days.
Conclusion
The EVgo Inc. stock is trading in a downtrend. The price has shown a decline in quarterly revenue. Also, the indicators are showing a negative signal.
Therefore, the price is highly likely to decline in the upcoming days.
Technical Levels
- Support Level: $3.57
- Resistance Level: $5.5
Disclaimer
The views and opinions of the author, or anyone named in this article, are for informational purposes only. They do not offer financial, investment, or other advice. Investing or trading crypto assets involves the risk of financial loss.




