
 Injective
 Pudgy Penguins
 Quantus
 Bitcoin
 Celestia
 Sui
Sui Derive
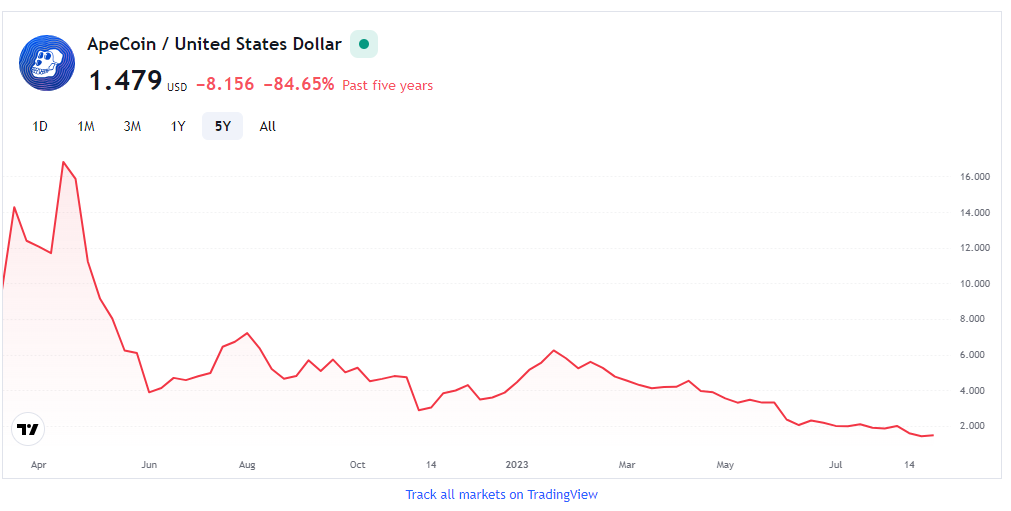
- The derivative volume for the APE coin has declined by -59.48% in the last 24 hours as per Coinglass.
- The price for the APE crypto has also been declining in the last 24 hours resulting in a decline of -0.43%.
Price Data of The ApeCoin
The circulating supply of the ApeCoin crypto is 368.5 Million APE. Its fully diluted market cap is $1.4 Billion. The volume/Market cap ratio for the coin is 6.32%.
The trading volume for the crypto has declined by -39.94% in the last 24 hours. It represents the lack of interest of traders in the crypto. The Open Interest for the coin has also declined by -0.21% in the last 24 hours.
The all-time high for ApeCoin was recorded on 28th April 2022. It was made at a level of $26.70 and since then the market declined by -94.44%. It indicates that the price of the crypto is weak in the larger timeframe. The market cap dominance of the crypto is 0.048%, resulting in a market cap rank of #68.
APEUSD Technical Analysis
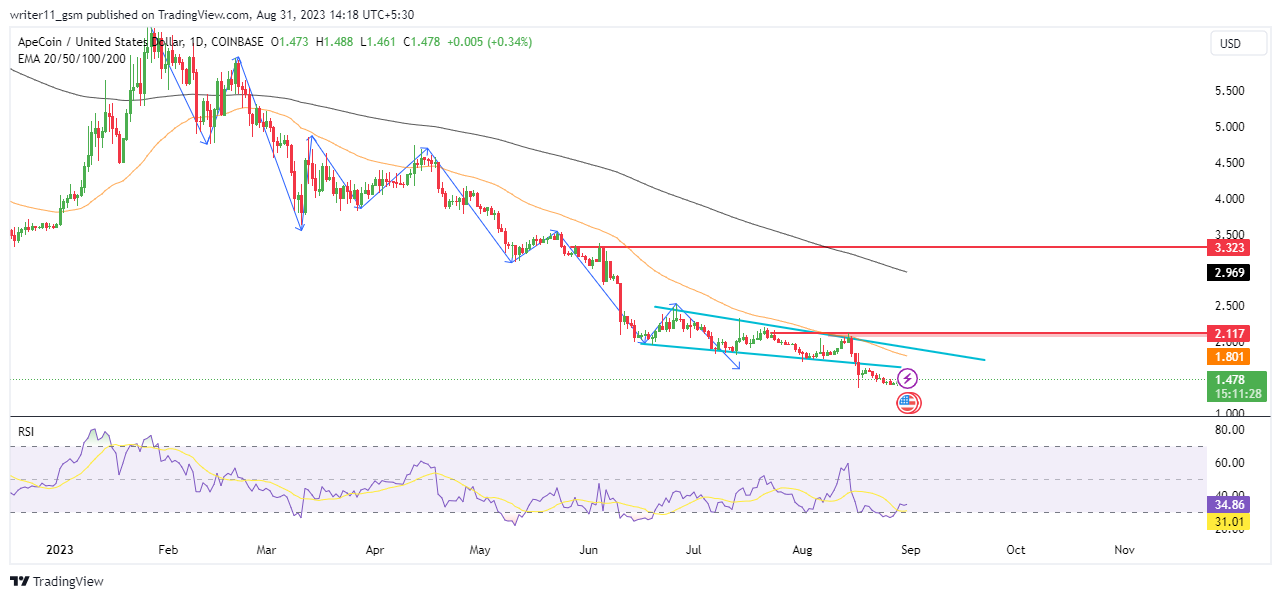
The ApeCoin Price has been dropping from the higher levels. It is making lower and lower swings that form a falling wedge pattern. The price has broken below the falling wedge pattern. It further results in no hope for the buyers in the crypto and the price is still declining.
As per the EMA analysis, the market is in a preceding downtrend. It is following a death cross of the 50-day and the 200-day Exponential Moving Average.
The RSI is on the daily timeframe for the ApeCoin. It also looks bearish as it has been consistently declining from higher levels. The RSI breached the level of 50 a few days ago. It was unable to sustain above the level, which led to a decline in the value of the indicator.
Technical overview of APEUSD
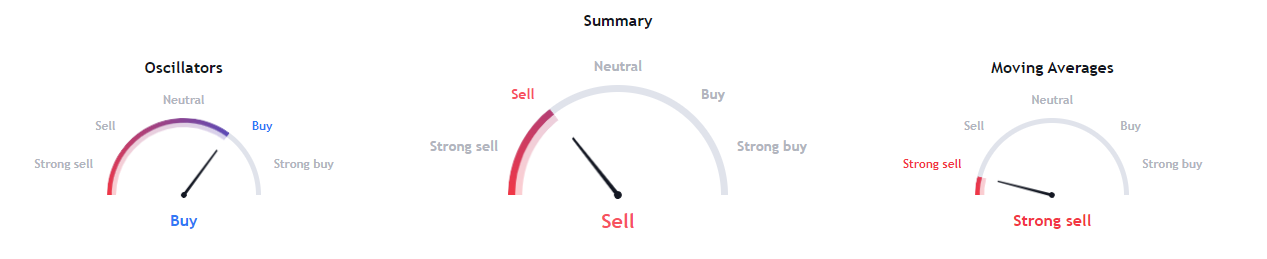
Based on the technical summary as per Tradingview, the oscillators are giving a buy signal. The EMA’s are acting bearish. The overall summary for the crypto suggests a downtrend. A sell signal is visible in the crypto’s overall trend.
Conclusion
The APE is in a downtrend, trading below the falling wedge pattern. The EMA and RSI are also acting negatively on charts in the daily timeframe.
Therefore, unless the price breaks above the level of 2.200, this trend will remain constant. The price of the coin may continue to decline.
Technical Levels
- The support levels for the ApeCoin coin are – $1.400 and $1.000
- The resistance levels for the ApeCoin coin are – $2.200 and $3.320
Disclaimer
The information provided in this article, including the views and opinions expressed by the author or any individuals mentioned, is intended for informational purposes only. It is important to note that the article does not provide financial or investment advice. Investing or trading in cryptocurrency assets carries inherent risks and can result in financial loss.




