
 Boomer
 Claudia
 Covenant x402
 Pearl
Pearl Bitcoin
 Quantus
 Pudgy Penguins
- The NG. stock price is currently trading at 991 GBX.
- The price is currently falling in a higher low formation with absolute dominance of sellers.
National Grid (LSE: NG.) was founded in 1989. It is a British multinational electricity and gas utility company that deals in the transmission and distribution of electricity and gas. The firm operates through various segments which are UK Electricity Transmission, YK Electricity Distribution, UK Electricity System Operator, New England, and New York.
National Grid (NG.) Stock Financial Analysis
The National Grid company has shown consistent growth in its revenue report in the last three years from 2020 to 2022 with a total revenue of 53.77 Billion GBP.
The company’s estimated revenue value for the year 2023 is expected to be 20.08 Billion GBP. Looking at the previous three-year the firm has maintained consistency to cross the estimated value this shows the capability of the company to meet its estimated revenue value for the year 2023.
The company has also consistently paid dividends to its shareholders over the last three years.
National Grid (NG.) Stock Technical Analysis
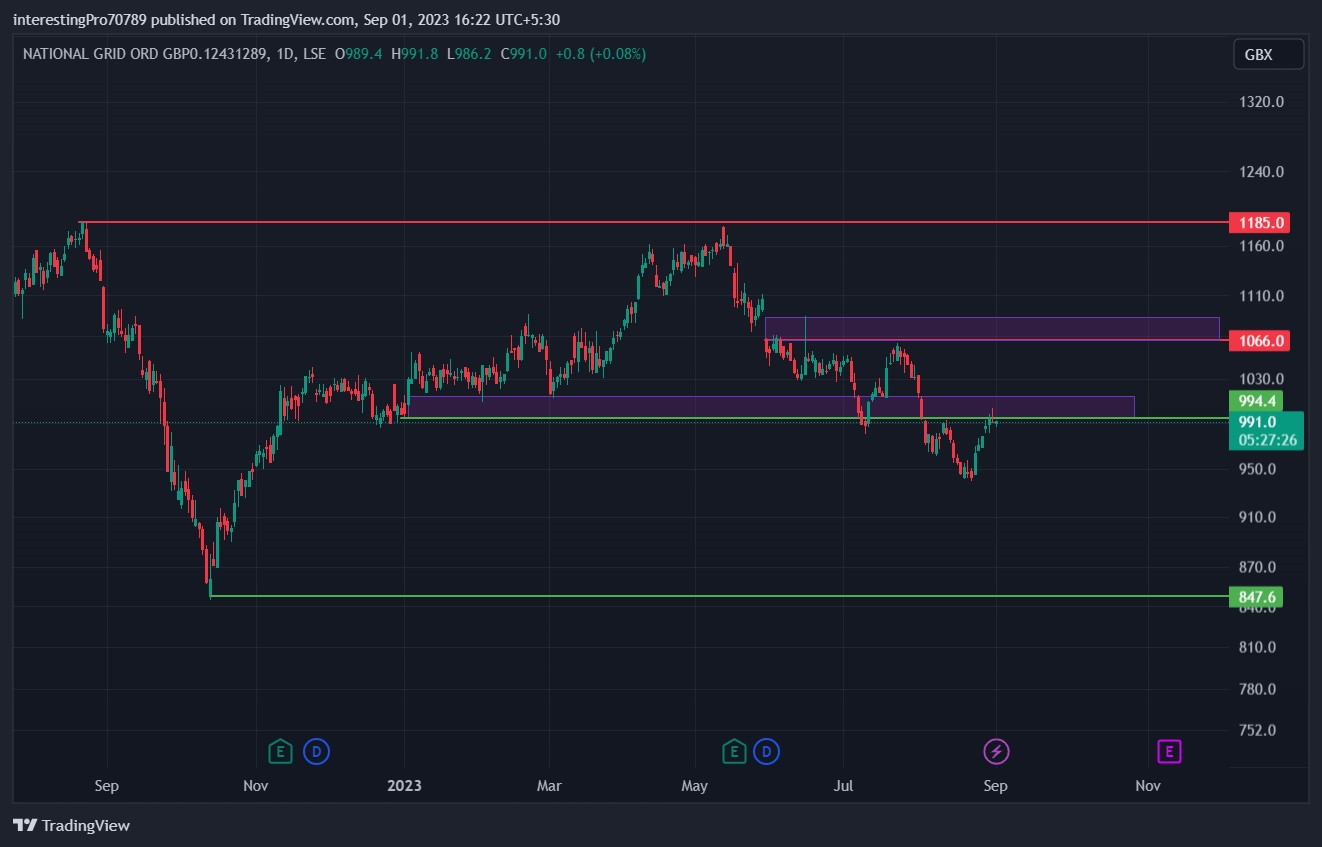
In January 2023, the price formed support at 994 GBX and commenced a bullish rally. The price went up to 1185 GBX resistance and faced rejection from there. The price after facing rejection from the 1185 GBX resistance falls back to 994 GBX support.
After reaching 994 GBX support the buyers again tried to push the price in the upward direction but the price faced immediate rejection from the 1066 GBX. The price after facing rejection from 1066 GBX the sellers came and made the price break below the 994 GBX support.
The price gave the breakdown of the 994 GBX support and started to fall. Recently the price has retested the 994 GBX support and is trading just below it. The price is in a higher low structure which indicates the seller’s strength. If the price respects the recent low of 994 GBX and faces rejection from there then the price could fall to its next support at 847.6 GBX.
However, if the price reclaims the 994 GBX support (which is acting as a resistance now), the price must have to give the breakout of the 1066 GBX resistance, in order to be in the bullish sentiment again.
Technical Indicators’ Prediction About the Current Trend
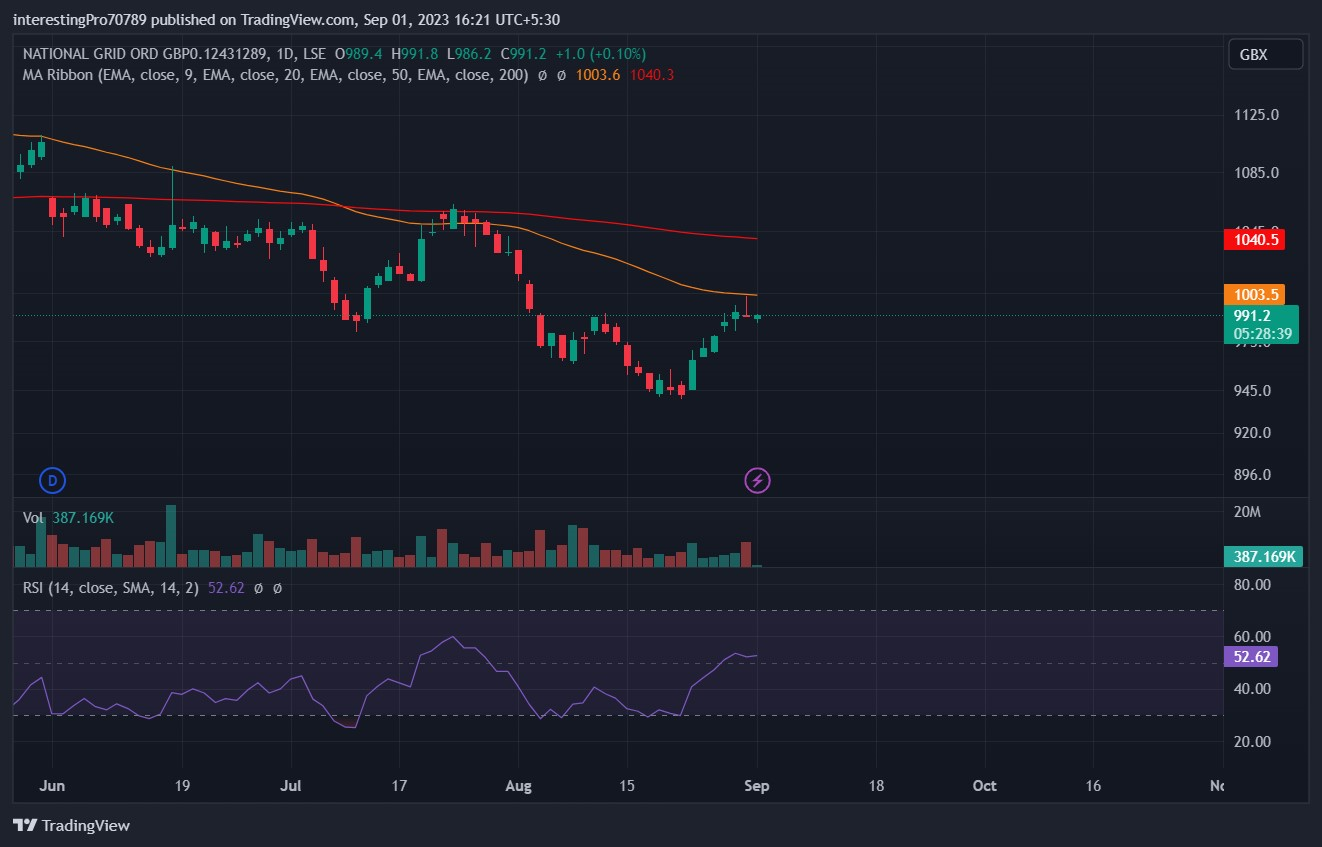
The yellow line which represents 50 EMA is at 1003.5 GBX and the red line which represents 200 EMA is at 1040.5 GBX. The price of NG. is trading below both the EMA’s which indicates the seller’s pressure and bearish sentiment over the price.
The relative strength index is at 52.62. The RSI line is in neutral territory which indicates the National Grid Price is currently being pressurized by sellers as well as buyers.
Conclusion
The overall chart of National Grid stock is bearish as the sellers are dominating the price and are forming a higher low structure. The price is trading just below the 994 GBX resistance and is facing rejection from there. If the price forms a strong bearish candle. With a good volume in it then the price could be seen falling to its 847.6 GBX support.
Technical levels
Resistance levels: 994 GBX and 1066 GBX.
Support levels: 847.6 GBX GBX.
Disclaimer
The views and opinions stated by the author, or any people named in this article, are for informational purposes only. They do not establish financial, investment, or other advice. Investing in or trading crypto assets comes with a risk of financial loss.




