
 Injective
 Bitcoin
 Quantus
 Sui
Sui Derive
 Pump.fun
 Quant
Quant
- The stock is rising above following the re-entry of bulls.
- The stock is in a consolidation phase with the possibility of a breakout.
- The price has bounced off its support levels after falling for more than 10 months.
DOCS stock started falling after making a gap-down opening back in November of last year. The gap-down opening made the stock fall past its immediate support of £213. However, in December, the bulls tried to fight back after the price bounced off the immediate support level of £173 and rose to £213 where the 50 EMA rejected the price again. This started a bearish trend in the stock price that continued until early July of this year. After making an all-time low of £113, the trend finally began to reverse.
Technical Analysis and Price Prediction of DOCS Stock
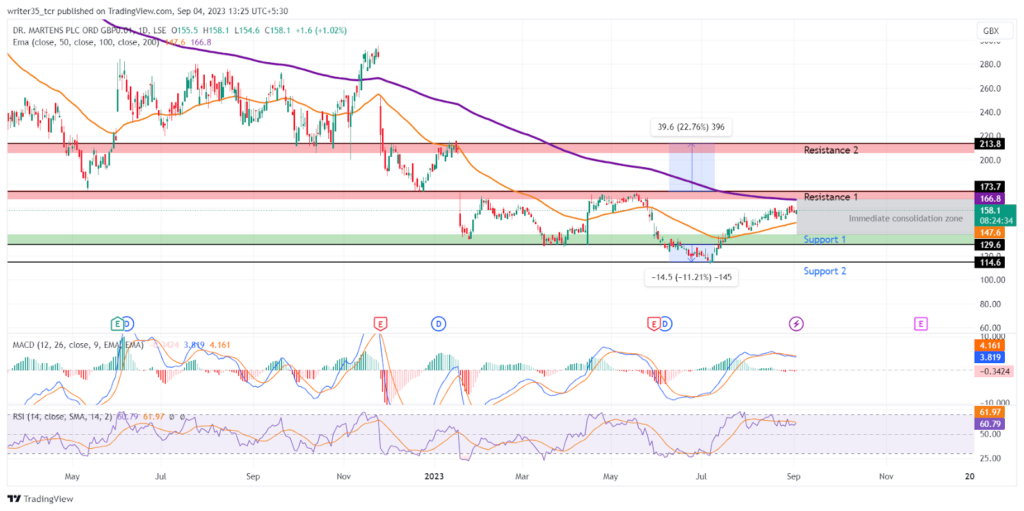
At present, the DOCS stock price is trading at the level of £157 and is surfing its 50 EMA after rising above it. The bulls are taking the price to its immediate resistance of £173, which was previously a support level that got breached. Furthermore, the second support level is at the all-time low of £114, while the second resistance level is at £213.
MACD, EMA, and RSI levels
The 200 EMA is just above the price at £168 which may give resistance if the bulls push further. The 50 EMA is giving consistent support to the stock after the bulls got past it in the middle of July.
Moreover, indicators like the RSI are showing a sideways trend after rising to its oversold zone of 70. The SMA made a bullish crossover with the RSI back in early July. At present, the RSI is at 59 while its SMA is at 61, which suggests that there is a possible weakness in the prices.
The MACD graph shows something similar to the RSI graph. The MACD line and its EMA made a bullish crossover during the start of July this year and it made both the lines cross past the neutral zone of zero. At present, there is a tussle going on between MACD and its EMA, and they are on the levels of 3.7 and 4.1 respectively.
What is the stock price forecast for Dr Martens?
This technical analysis suggests a bearish momentum if the price falls below the 50-day EMA following rejection by bears at the 200-day EMA. Conversely, a bullish trend could emerge if the price manages to rise above its 200-day EMA and surpass immediate resistance levels. It’s important to note that the bullish trend appears to have lost some steam, as indicated by the RSI and the MACD, which may lack the necessary momentum to overcome prevailing bearish forces.
Technical Levels
Support: £129, £114
Resistance: £173, £213
Disclaimer
The views and opinions stated by the author, or any people named in this article, are for informational purposes only. They do not establish financial, investment, or other advice. Investing in or trading crypto assets comes with a risk of financial loss.




