
 Minter
 Quack AI
 Quantus
 Pudgy Penguins
 Bitcoin
 Bittensor
 Boomer
- The F stock price has advanced by 27.46% in the last five years.
- The dividend yield by the company in the year 2022 is 4.17%.
The beta for the Ford Motor Company is 1.67. It indicates that the stock moves equal to or more as compared to the market. It means the stock may make uncertain moves during normal trading days. The company also has 3.931 Billion shares floating in the market for trading.
The Ford Motor Co. was founded in 1903 and has expanded across the globe. It operates in the automotive industry. James D. Farley is the CEO of the company. This firm has over 173,000 employees and its headquarters are located in in Dearborn.
The basic EPS of the F stock is 1.04 USD, which means that it makes a profit of $1.04 on each share. This company’s current market cap is 48.307 Billion USD. It generated a revenue of 158.057 Billion USD in 2022. The net income of the company has consistently advanced by +216.0% in the last year.
Ford Motor Company Performance Analysis
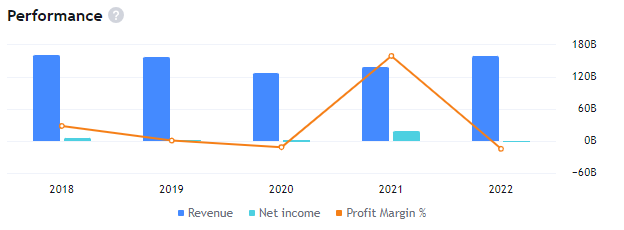
The company has made a total revenue of $158.06 Billion in 2022. Its gross profit stands at 16%. The net income of the company has drastically declined by $19.92 Billion as compared to the year 2022. The current profit margin of the company stands at -1.25%.
Ford Motor Company Technical Analysis
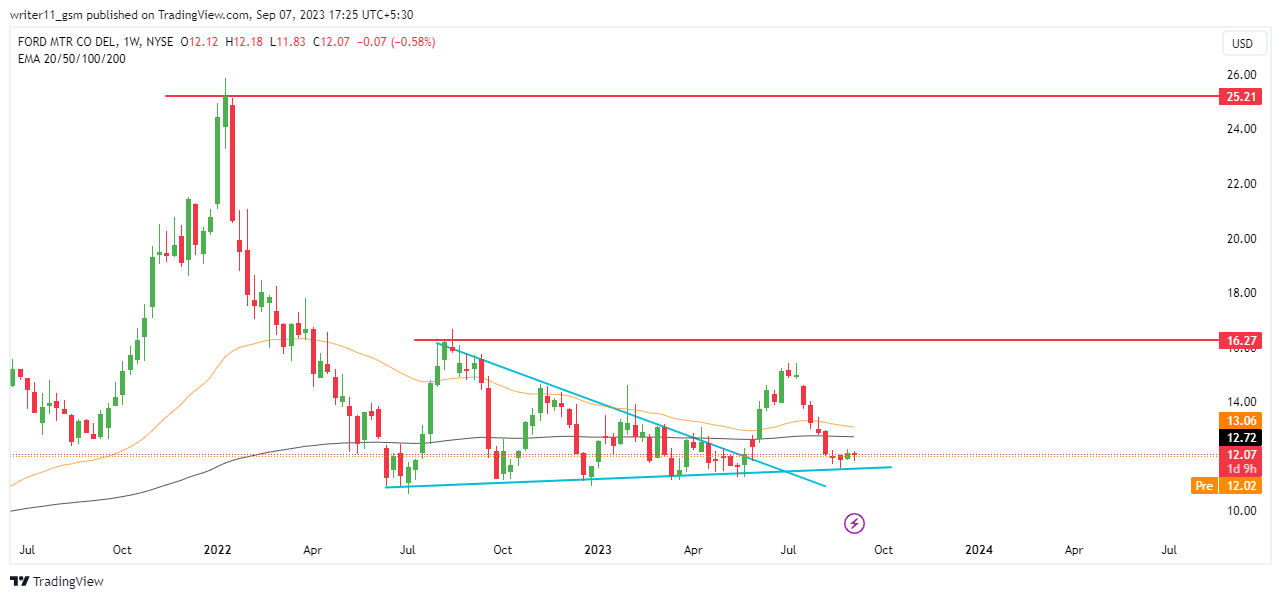
The F share’s value has been declining for a very long time. It led to the formation of a descending triangle pattern. It was broken out a few days ago, but the market was unable to sustain at higher levels. Thus, broke down to the support levels and it is currently consolidating at the same level. If the price sustains at the current levels, we might get to see new highs on the charts.
Due to a swift decline in the price from higher levels, the RSI has declined below the 50 level. If the market fails to break above the same level and hits overbought zones, we can see a further decline in the stock value with volatility in the market.
The market is trading in a golden cross as the 50-day and the 200-day EMAs are following an uptrend for a very long time. However, the EMAs have contracted and are trading close to each other.
Technical Overview of Ford Motor Company Stock
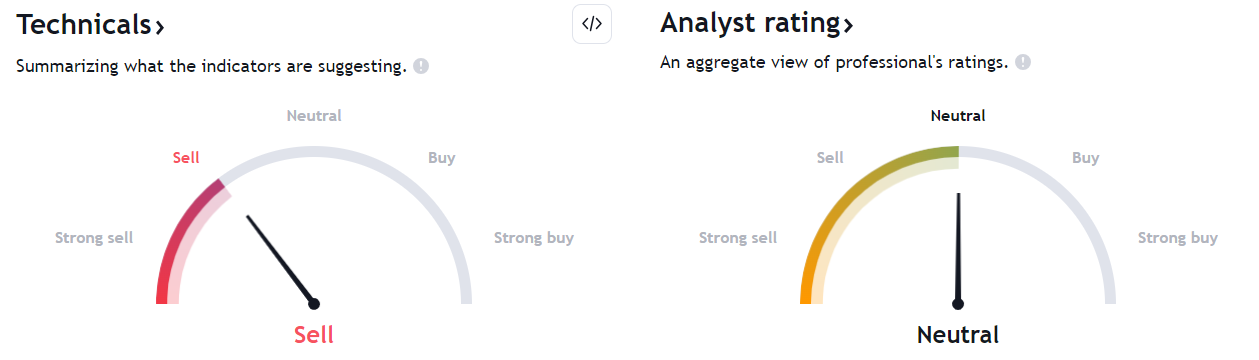
We can assess that a majority of indicators, including EMA’s and multiple oscillators, are bearish for the stock. Professional analysts are neutral on the stock based on the current financials.
Conclusion
The market structure of the Ford Motors Co. stock is uncertain. It is trading at the support levels. The EMA’s are bullish and the RSI is weak on charts. Unless it breaks above the previous swing high or breaks below the support, the price can stay volatile.
Technical Levels
- The support levels for F Stock are – $4.00 and $11.00
- The resistance levels for F stock are – $16.00 and $25.00
Disclaimer
The information provided in this article, including the views and opinions expressed by the author or any individuals mentioned, is intended for informational purposes only. It is important to note that the article does not provide financial or investment advice. Investing or trading in cryptocurrency assets carries inherent risks and can result in financial loss.




