
 Celestia
 Quantus
 Starknet
 Pearl
Pearl LayerZero
 Lighter
 Bitcoin
- The company is reporting huge revenue growth but it is still a red flag. The reason behind this is discussed below.
- The stock is near its all-time low with no actual support below.
- The MACD and RSI are on the verge of a bullish crossover but the 50 EMA can cause problems.
The stock of Lucid Inc. (NASDAQ: LCID) has been on a downward trend since November 2021 when it reached its peak of $55.2. At the time of writing, it is at an all-time low. To assess the actual financial status of Lucid Inc., let us take a look at their financial statements.
The income statement indicates that the company consistently generates revenue on an annual and quarterly basis. In the year ending December 2021, the company recorded a revenue growth of 581%. Fast forward to 2022, and the revenue of $27 Million from a year ago has increased to $608 Million, which reflects a staggering growth of more than 2000%.
However, looking closer, the financial statement paints a different picture – the company is incurring losses across the board, from gross profit to net income. One might say that the firm is in a growth phase and is focused on generating maximum revenue, but one of the biggest red flags for investors is that the firm’s cost of goods is almost twice the revenue. This significant cash burn is the reason why investors are exiting the LCID stock, causing the stock price to free-fall.
Technical Analysis and Price Prediction
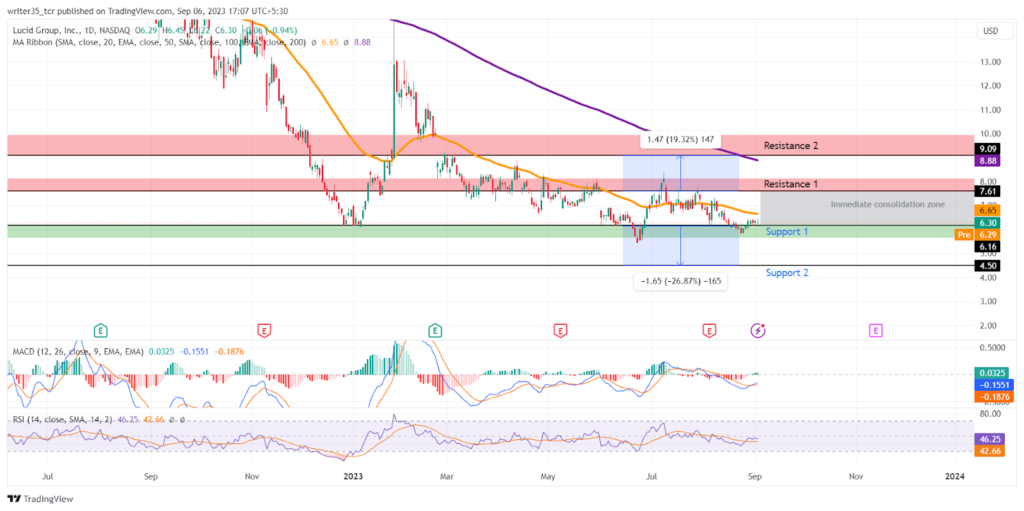
The stock price of LCD is currently experiencing a slight downturn since it reached its highest point of $17.8 in January 2023. At present, it is trading at $6.30. LCID stock has just surpassed its immediate support level of $6.16. However, the next support level is at a round-off value of $4.50, which is very close to its all-time low, and so it can be viewed as psychological support. On the other hand, the immediate resistance level is at $7.61, while the second resistance level is at $9.09.
What are the indicators showing?
After analyzing the support and resistance levels, it appears that the indicators are suggesting a bullish trend altogether. The MACD has experienced a bullish crossover with its exponential moving average (EMA) back at the end of August 2023. The MACD line is currently at -0.155 and its EMA is at -1.9, indicating a strong bullish momentum.
Furthermore, the relative strength index (RSI) has spiked up after reaching its oversold level of 36 and is now sitting at 46, which suggests a neutral market territory for both the bears and the bulls. On the other hand, the 50 EMA is seen rejecting the price since the LCID price fell below it in February this year. At present, the 50 EMA is at the level of $6.65 while the 200 EMA is up to $8.88
Conclusion
The price prediction for LCID stock is looking bullish only if the bulls can break past the 50 EMA. Otherwise, as it is close to the immediate support level, taking a bounce will result in the price levels falling further down to the second support level of $4.50.
Technical Levels
Support:$6.16, $4.50
Resistance: $7.61, $9.09
Disclaimer
The views and opinions stated by the author, or any people named in this article, are for informational purposes only. They do not establish financial, investment, or other advice. Investing in or trading crypto assets comes with a risk of financial loss.




