
 Dacity Coin
 Pearl
Pearl Injective
 Pudgy Penguins
 Pump.fun
 Quant
Quant Quantus
- The SDR price is trading at 403.3 GBX.
- The price has given a breakdown of the support zone of 425.2 GBX.
- The sellers are shifting to each recent high the price made.
Schroders Plc (LSE: SDR) was founded in 1804. It is an asset management company that deals in investment management activities. The company runs through segments which are Asset Management and Wealith Management segments.
Schroders Plc (SDR) Stock: Financial Analysis
The Schroders Plc revenue in 2020 was around 2.57B GBP which showed a decline of 0.44% compared to its previous year. In 2021, the company generated a revenue of 3.02B GBP which covered the decline by 17.72% compared to 2020 revenue. But in 2022, the firm only generated revenue of 2.93B GBP which showed a decline of 3.16% compared to 2021 revenue. The trailing-twelve-month (TTM) revenue for 2023 is currently running at 2.96B GBP.
The company’s net income in 2020 was around 476.30M GBP and compared to its previous it showed a decline of 3.60%. In 2021 the company increased its net income to 611.90M GBP and covered the decline by 28.47%. But in 2022, the company only generated a net income of 479.70M GBP which showed a decline of 21.60% compared to 2021 net income. The trailing-twelve-month (TTM) for 2023 is running at 439.20M GBP at the time of writing.
The company has slightly decreased its total debts every year from 2020 to 2022.
The firm has been paying a dividend good dividend payout ratio to its shareholders with an average of 63.77 payout ratio.
The company has been very inconsistent in its financial growth over the last three. Even after so much of inconsistencies, the firm has shown a reliable dividend payout ratio over the last three years.
Schroders Plc (SDR) Stock: Technical Analysis
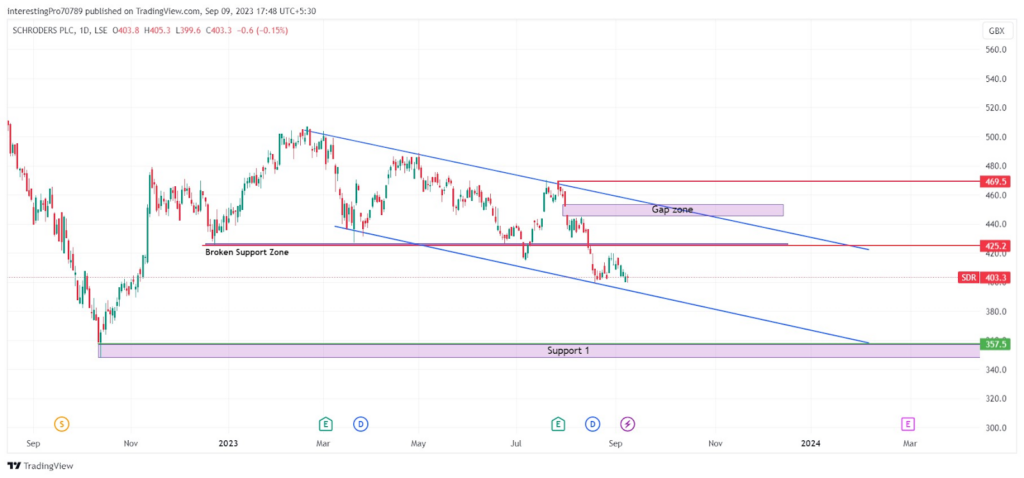
In October 2022, the SDR price formed support and initiated a bullish rally to 479.2 GBX. When the price reached there it started facing rejection and fell to 425.2 GBX. It again tried to bullish a rally and made a 2023-year high of 507 GBX.
The moment the price reached to year’s high it started facing rejection and fell back to its 425.2 GBX. The price again initiated a bullish rally but after reaching 488.6 GBX faced rejection of the trendline that was forming above. The price again fell back to its 225.2 GBX support.
In July 2023, the price gave the breakdown of the 425.2 GBX but faced an immediate rejection and reclaimed the 425.2 GBX support. The price after reclaiming the support commenced a bullish rally to 469.7 GBX and faced rejection from the trendline.
The price started to fall and showed a gap-down opening in the price and fell to its 425.2 GBX support. In August 2023, the price gave the breakdown of the support. Currently, it is sustaining below the broken support of 425.2 GBX and has taken support from the trendline which can be formed below.
If the price stays below the broken support of 425.2 GBX then the possibility is that it can fall to its historical support at 357.5 GBX. However, for the price to be in bullish sentiment and to fill the gap it must reclaim the 425.2 GBX support. It should sustain over the support and then it may rise to 469.5 GBX.
Technical Indicators’ Prediction About the Current Trend
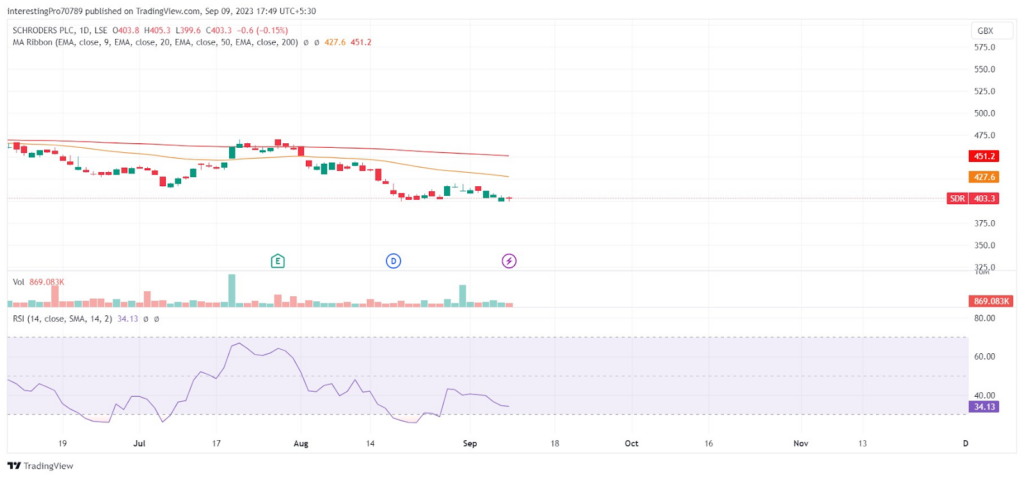
The Schroders stock price is trading below the 50 and 200 ema which indicates the price is in bearish sentiment and in under the of sellers.
The relative strength index is at 34.13. The RSI line is in bearish territory which indicates that the price is in bearish sentiment and the sellers have taken full control over the price.
Conclusion
The Schroders stock price is in bearish sentiment at the time of writing. The price has recently given a breakdown of 425.2 GBX support. The price can be seen trading in a falling parallel channel. If the price stays below the broken support of 425.2 GBX then it may fall to its historical support at 357.5 GBX. However, for the price to be in bullish sentiment and to fill the gap it must reclaim the 425.2 GBX support. It should sustain over the support and then it may rise to 469.5 GBX.
Technical levels
Resistance levels: 425.2 GBX and 469.5.
Support levels: 357.5 GBX.
Disclaimer
The views and opinions stated by the author, or any people named in this article, are for informational purposes only. They do not establish financial, investment, or other advice. Investing in or trading crypto assets comes with a risk of financial loss.




