
 Dacity Coin
 Pump.fun
 Pudgy Penguins
 Bitcoin
 Pearl
Pearl Monad
Monad Zcash
Zcash
- The SLB stock is trading at a 52-week high.
- The stock has given a wonderful return of more than 7000% since listing.
- It is down by almost 50% from its all-time high value.
How the Stock Has Performed Till Now?
This Schlumberger stock was listed near $1 and went as high as $118 (return of over 15000%) in June 2014. This stock experienced a huge downfall after touching the all-time high value. It collapsed almost 90% from its all-time high levels and made a low of $12 during the coronavirus phase. The SLB stock later recovered from those levels and gave an appealing 400% return within 3 years. Now, it is trading at $60. It was surely a roller coaster ride for the SLB stock investors.
Technical Analysis of the SLB Stock on a 1-Week Time Frame
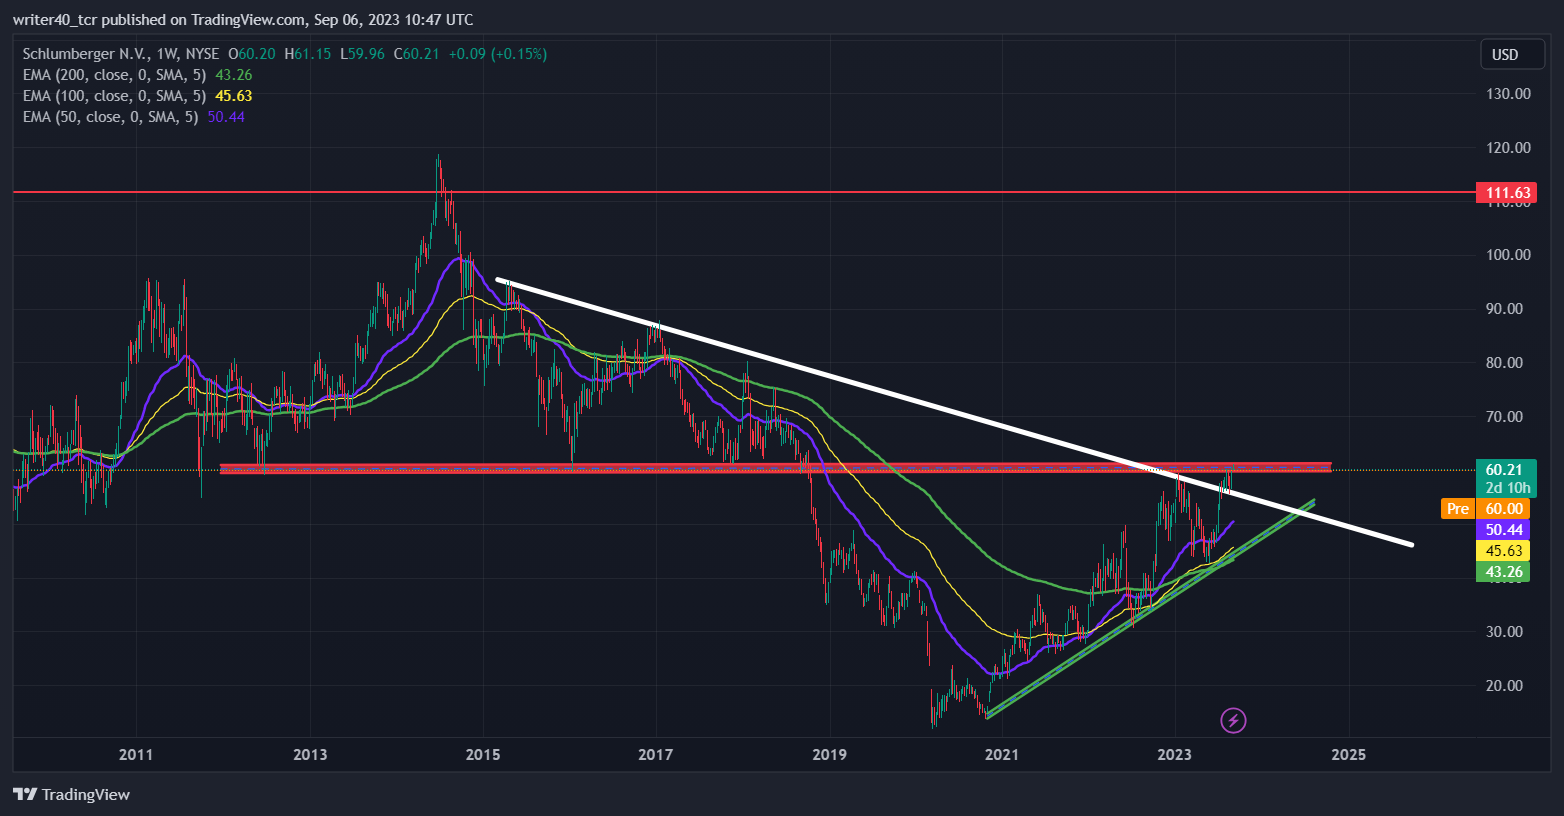
The Schlumberger stock is currently giving a breakout from a symmetrical triangle pattern. Now, it is facing resistance from previous support levels near $60. The price will get support from the trendline near the $45 level. The stock price is trading above all three EMAs, which shows the stock is trading in an uptrend. The price can take support also from the symmetrical trendline breakout line displayed in white color in the chart.
Technical Analysis of the SLB Stock on a 1-Day Time Frame
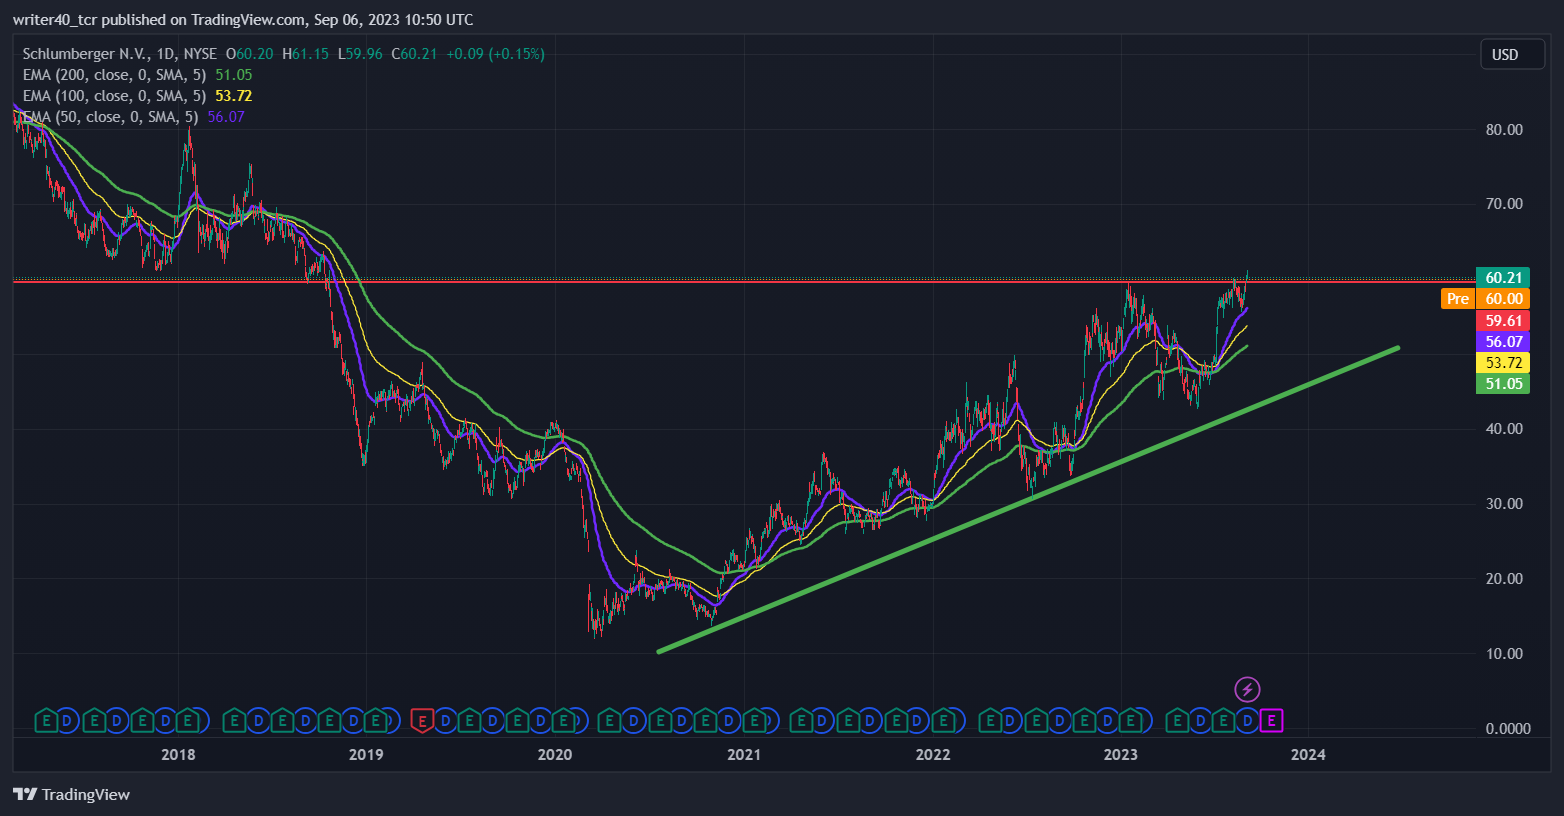
In the 1 day time frame, the Schlumberger price is trying to cross the resistance levels as shown in the chart. The stock is looking strong at those levels and trading above the major EMA levels. The upward-sloping trendline is acting as a support for the stock. The market structure is bullish as the price is forming higher highs and higher lows patterns. The price can go up as long as the shown structure is intact.
Technical Analysis of the SLB Stock on a 1-hour Time Frame
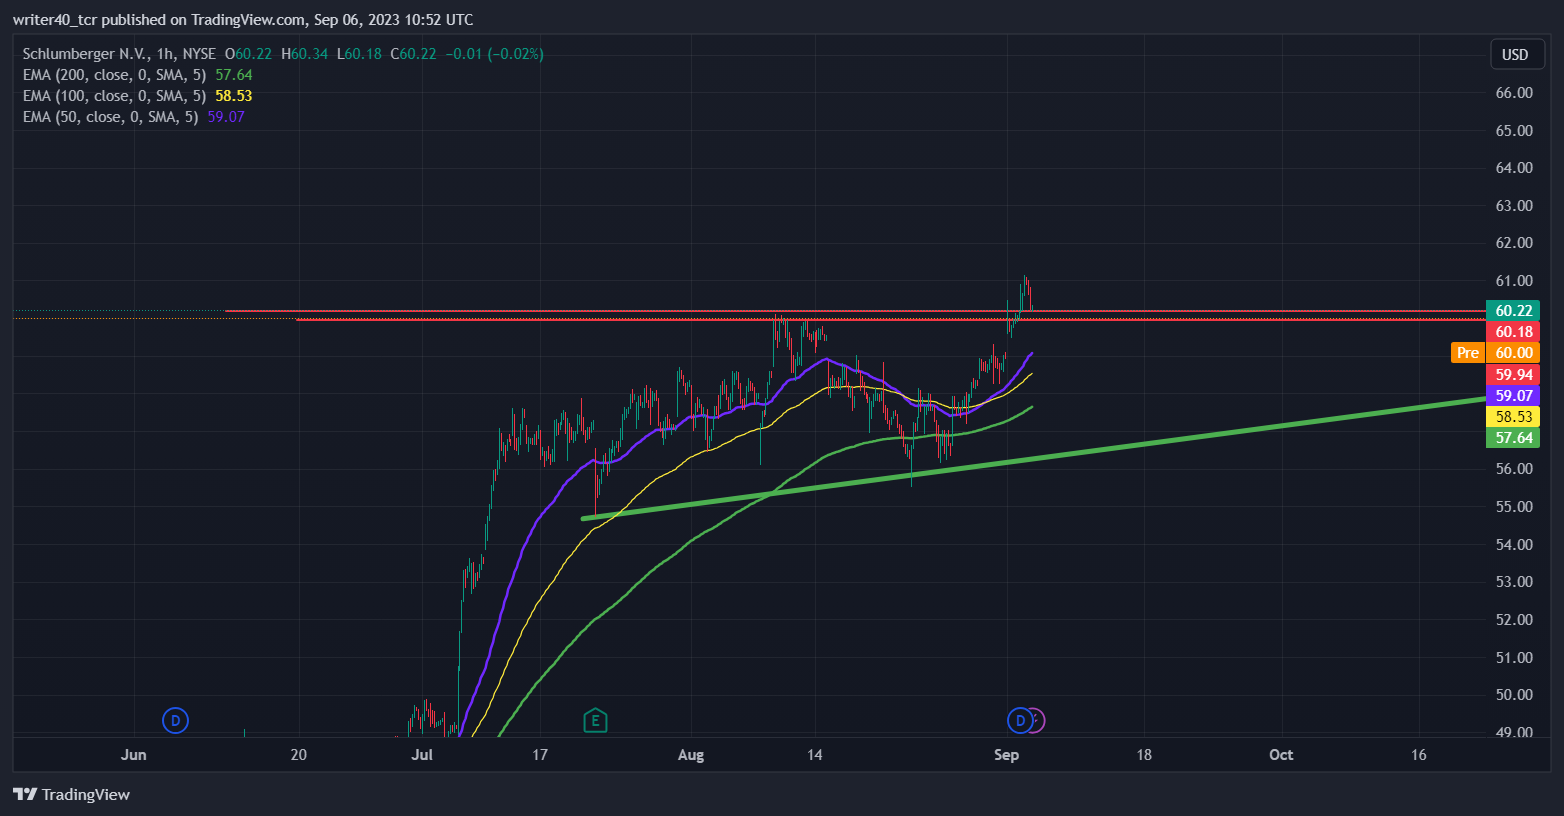
It is looking good for a bullish trend as the stock recently broke the rising wedge pattern. The SLB stock is now trading near the support levels or it came to retest the pattern. The price is trading above the major EMAs, which is sloping upward. The EMAs are present at $57.64, $ 58.53, and $59.07 respectively. Those levels can hold the price up for some time.
Conclusion
The Schlumberger stock is looking extremely bullish on every time frame. The stock gave a breakout of a symmetrical triangle pattern on the weekly time frame. It crossed the previous swing high which now can act like a support on a daily time frame. In 1-hour time frame also the stock crossed the resistance levels. If it takes support from the same levels and crosses the recent high, then it can resume the uptrend.
Technical Levels
Resistance – $ 60 levels
Support – $ 58 levels
Past Performances
1 week- 3. 90 %
1 Month- 3. 38 %
1 Year- 58. 03 %
Disclaimer
The views and opinions stated by the author, or any people named in this article, are for informational purposes only and do not establish financial, investment, or other advice. Investing in or trading crypto assets comes with a risk of financial loss.




