
 streamoors
 Injective
 Pudgy Penguins
 Celestia
 Pearl
Pearl Sui
Sui Bitcoin
- UKW is a British company which invests in UK wind farms.
- UKW was established in 2012 and the chairman is Tim Ingram. The stock is listed on London Stock Exchange.
- In this article we will analyse the UKW stock price.
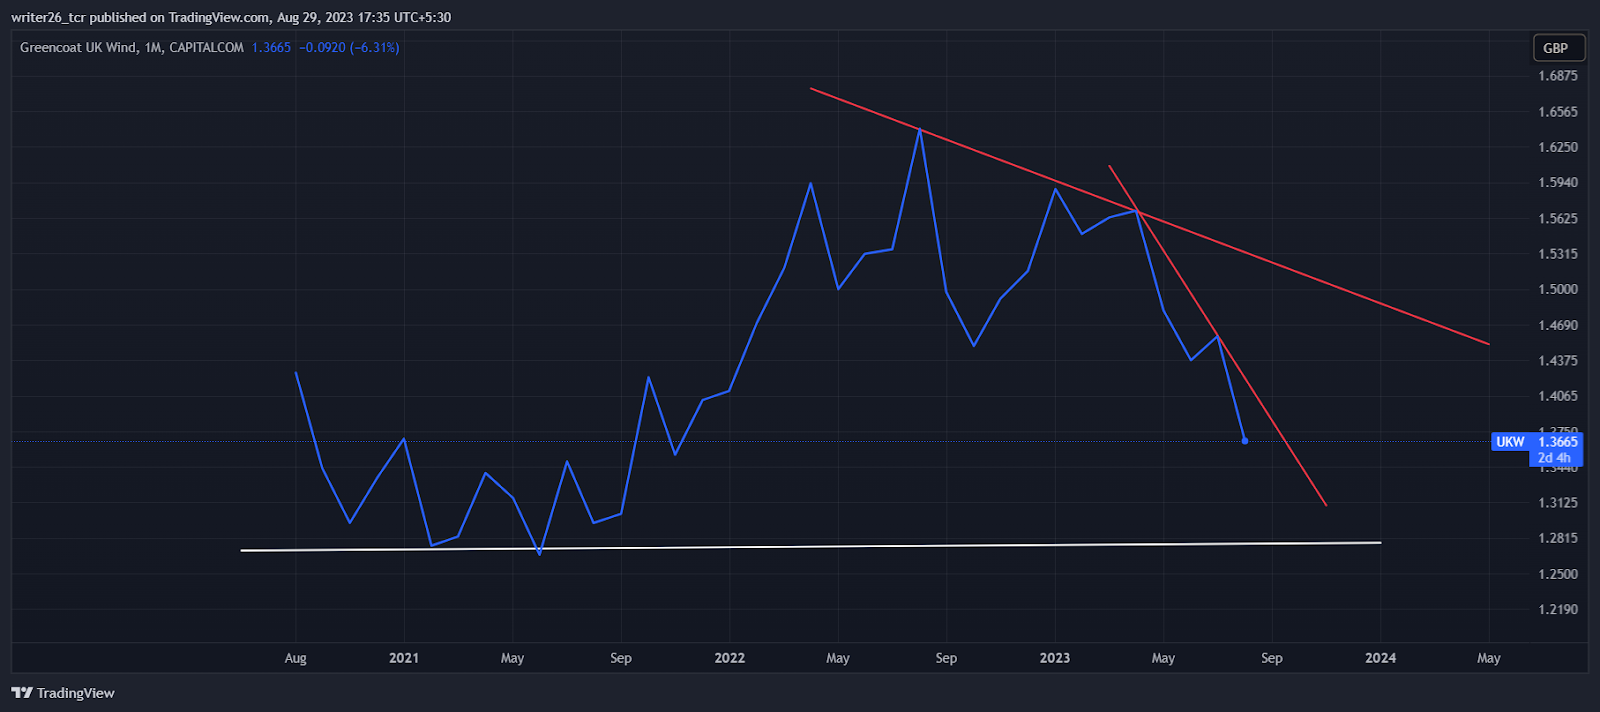
UKW stock is newly listed stock so the trend is not clearly predictable and the yearly analysis is also not possible. The stock in the monthly time frame is not properly in uptrend. Before Aug ’22 it was in uptrend and after it was in downtrend position.
However, the UKW stock is not good for long term investment because after Jan ’22 it is continuously in downtrend or is falling after Jan’22.
Moreover, in the weekly time frame also the stock was in uptrend but at current market price it is in downtrend. The stock is in a downfall and it never crossed its all time high. After the all time high it only went down and is breaking the support and levels.
As data is not very much clear in the yearly time frame so we will analyse the stock in monthly,weekly and daily time frames.
Technical Analysis of UKW(Monthly)
Source: LSE: UKW by Trading View
In the monthly time frame the UKW stock was in uptrend till Sept 2022 and after that it started falling down and is in downtrend at the current market price so the stock is good for the short term investment but investors should wait for a good opportunity to invest their money. They should wait for the breakout. Overall the stock is in a sideways position so the chances of good return on investment becomes less.
UKW stock is currently in downtrend so there’s an opportunity for short sellers to earn good return on investment and the intraday traders can also earn good return by short selling.
Technical Analysis of UKW(Weekly)
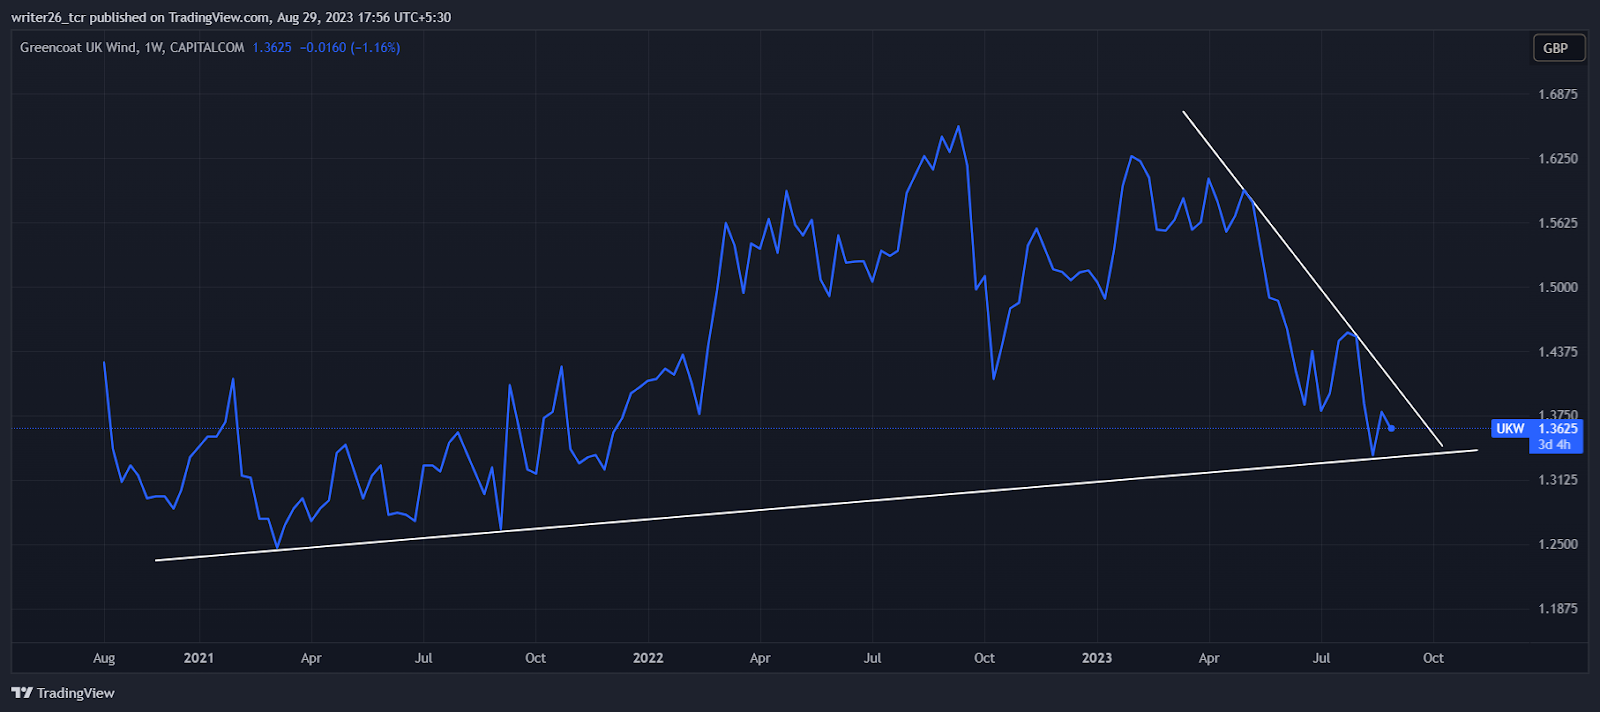
In the weekly time frame the stock is good for short selling but not good for long term investment. The investment should be made when the stock gives any breakout. There is no sign of recovery near current market price but there’s a chance that stock can fall by taking resistance from the near trend line and can make new lower lows and lower highs.
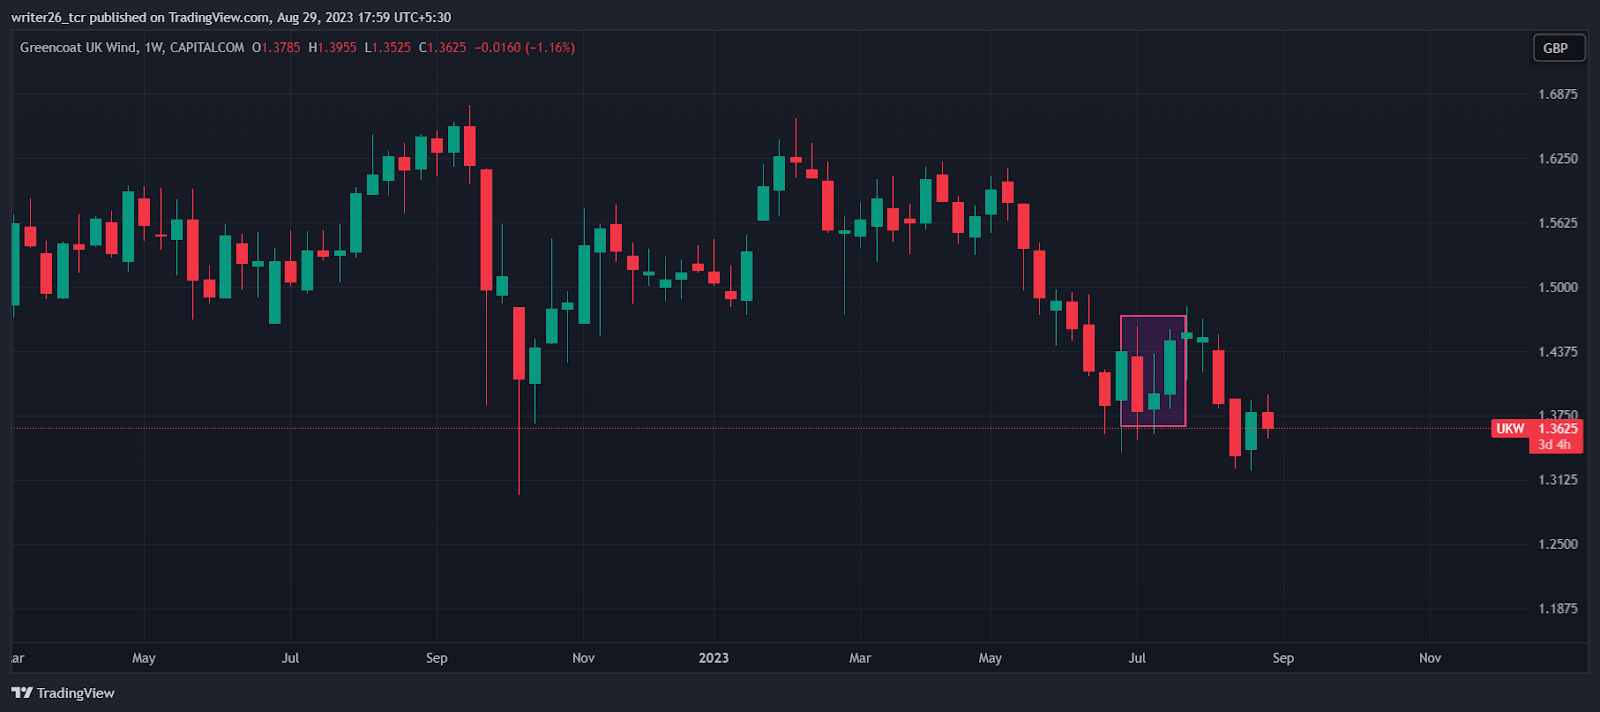
In the weekly time frame the pattern highlighted in the rectangle indicates that the upper move break and the downtrend may continue and it happened after the formation of morning star.
Technical Analysis of UKW(Daily)
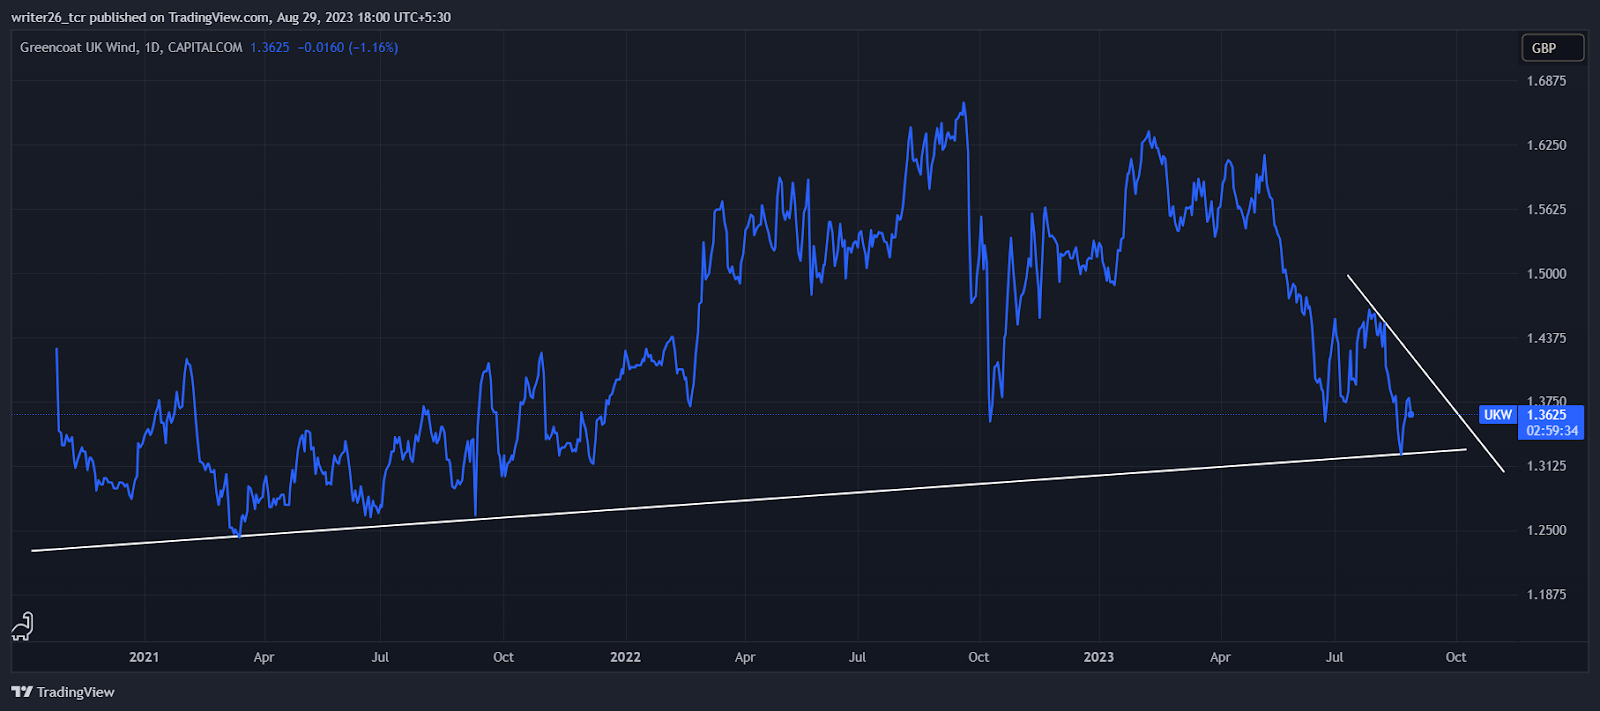
In the daily time frame the stock is in uptrend but near current market price it is in downtrend. The bears are present in the market and the bulls are less. So the bears have the opportunity to short sell the stock.
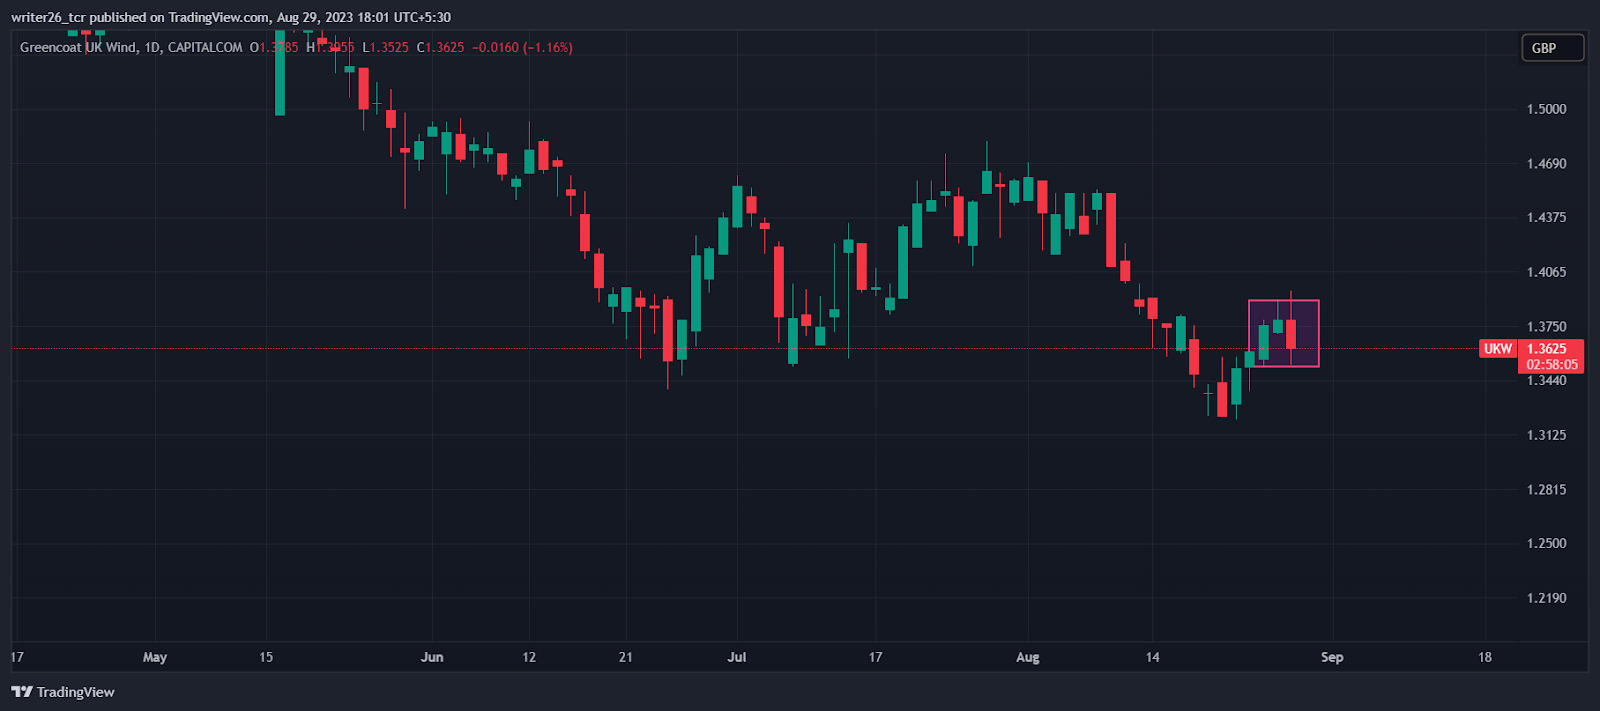
The evening star present in the rectangle indicates that the trend may reverse as the stock is in downtrend so the upward move can be reversed and starts downtrend after the evening star pattern.
Levels
Resistance Level- GBP 1.6410 and GBP 1.6105
Support Level- GBP 1.3050 and GBP 1.3540
Summary
Overall the stock is in a sideways position so the return on investment will be low. It’s better to invest in uptrend companies. As per the analysis the stock is good but not great for investment.
Disclaimer
The analysis is done for providing information through technical analysis and no investment suggestions are given in the article.



