
 streamoors
 Injective
 Pudgy Penguins
 Celestia
 Pearl
Pearl Sui
Sui Bitcoin
- ETC (Ethereum Classic) is a decentralized platform for running smart contracts. Initially, it was released on 30 July 2015 by Vitalik Buterin.
- ETC is the native cryptocurrency of the Ethereum Classic blockchain. It is traded on cryptocurrency exchanges under the code of “ETC”.
- Let us interpret the coin and gather some important information about it through technical analysis.
Technical analysis: ETC
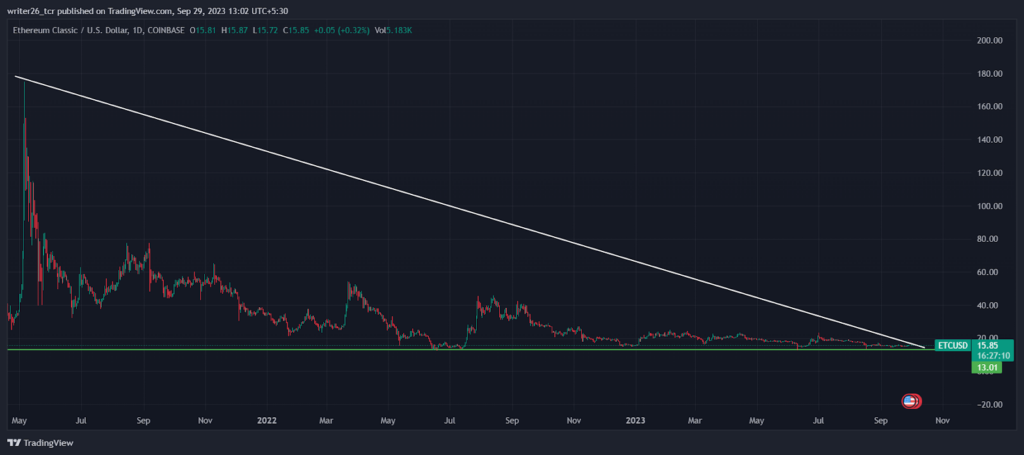
Since May 2021, the coin has been falling continuously. At the bottom, it made a strong support level. The coin is not able to break through that level. It might be possible that it can make more support points along the green line.
In the one-day time frame, the price is up by 3.11%. The percentage is fluctuating because it is being actively traded in the market.
As of the latest data, the Fear & Greed Index (F&I Index) for the ETC token stands at 48, categorizing the current market sentiment as “Neutral.” This suggests that there is a balanced or uncertain sentiment prevailing among ETC investors and traders.
Over the past 30 days, ETC has experienced 14 out of 30 days with positive price movements. This indicates a somewhat bearish trend during this period. However, it’s important to note that the F&I Index takes into account a broader range of factors beyond recent price changes, such as social media sentiment, trading volumes, and market volatility.
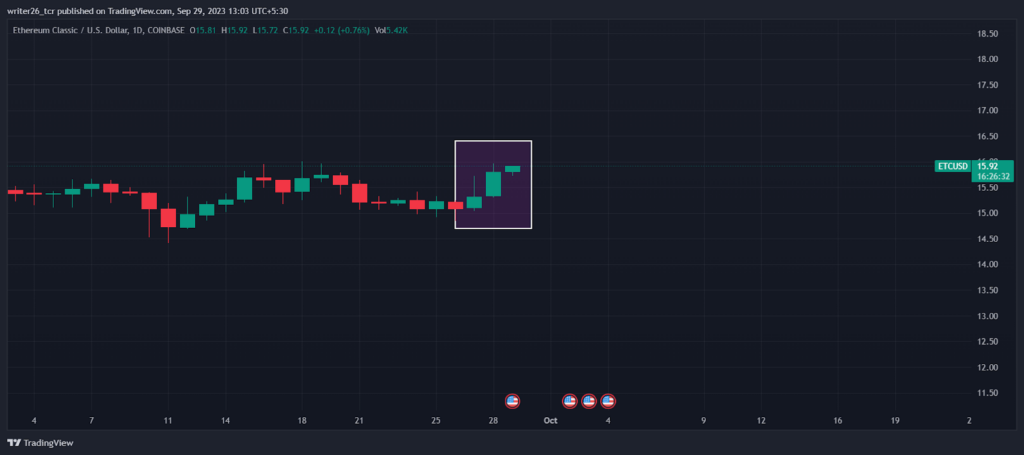
In the candlestick pattern, the coin indicates that the formation of a bullish candlestick will help the coin to move upward.
Its all-time high of $237 was formed on 1 April 2021. Its all-time low of $2 was formed on 16 March 2020.
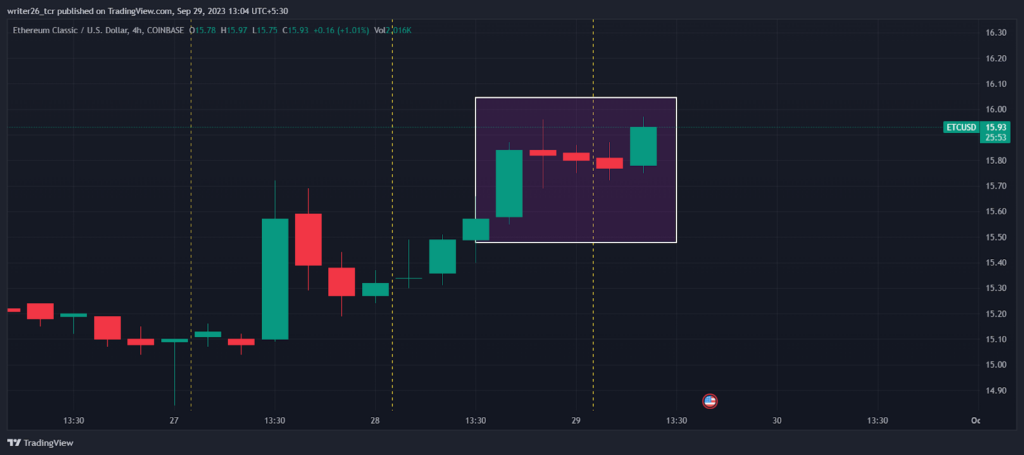
This formation is known as the “Rising Three Bullish Candlestick Pattern”. It is an indicator of bullishness which means that the price might move up and the coin might become bullish.
This pattern appears when there is an uptrend and its formation confirms that the price will continue moving up. It is formed in the 4-hour time frame.
Market information about ETC
The market capitalization of ETC is $2,282,178,704. Its market cap increased by 2.90%. The volume in 24 hours has decreased by 25.04% and the percentage is fluctuating. Its trading volume in the last 24 hours is $81,853,189. Going by market capitalization, it is ranked 28th out of the total 9,066 active cryptocurrencies.
The liquidity percentage of ETC is 3.54%. Its total market supply is 210,700,000 ETC. The current circulating market supply is 143,247,605 ETC which is 67.99% of the total supply.
Price Forecast of ETC (2024-2030)
| Year | Minimum | Maximum |
| 2024 | $ 15.85 | $ 80.50 |
| 2025 | $ 13.80 | $ 35.82 |
| 2026 | $ 14.00 | $ 30.94 |
| 2027 | $ 14.47 | $ 19.29 |
| 2028 | $ 16.55 | $ 112.23 |
| 2029 | $ 11.86 | $ 43.17 |
| 2030 | $ 12.16 | $ 37.65 |
Live chart
Summary
The technical analysis assessment shows that the coin is currently in a downtrend.
A recovery is not likely because of its bearish momentum. However, It may be profitable to invest in ETC as its value might increase by 404% next year. So, it might not go beyond the $13 price level in the future.
Technical Levels
Resistance Level- $4.7
Support Level- $3.2
Disclaimer
This is a general article that does not provide any financial or investment information. Investors should focus on both technical analysis as well as fundamental analysis. The analysis is done to provide information to readers. To make them aware of investments.




