
 Dacity Coin
 Pearl
Pearl Monad
Monad Aerodrome Finance
 Pump.fun
 Pudgy Penguins
 NeoSoul
- The company has recently gained 1.92% in the last three trading days after the decline in its share price.
- Nike Insider Bought shares worth 1,256,611 USD as the share price of NKE fell.
Nike Inc. (NYSE: NKE) is a sports footwear and apparel company, mainly famous for its footwear. The company manages the manufacture, development, design, and sale of its footwear, apparel, and other accessories and services. It is one of the largest suppliers of shoes and majorly manufactures sports equipment.
$1,256,611 Worth Shares Bought by Nike Insider
On 2nd October 2023, Robert Holmes Swan, ex-CEO of Intel, bought 13,072 Nike shares worth 1,256,611 USD. According to the SEC Form 4, Swam has control over 19,585 Nike shares of which 18,005 are held directly by him and 1,580 shares controlled are indirectly.
The Nike shares were bought on 2nd October 2023 due to which a gap left in the NKE chart was not filled. After that, the price gained around 1.92% in the last three trading sessions.
Nike (NKE) Stock Price Analysis
The NKE stock is down by an intraday decline of 0.1% and is trading at $95.79. The current market capitalization of the company is 146.566 billion USD and trades with a 10-day trading volume average of 12.374 million.
Will the Price Fill the Gap in the 1-Day Chart of NKE Stock?
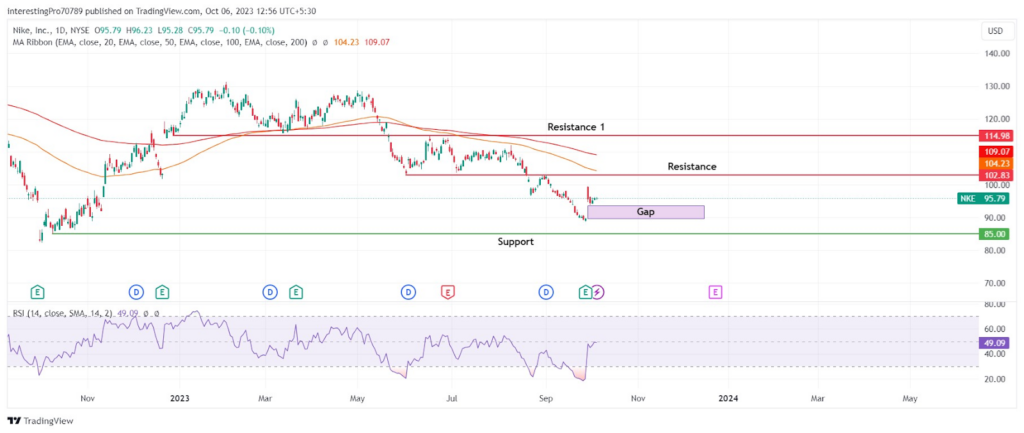
If we look at the price movement of NKE, we can see that the price has been declining for the past few months. It follows a pattern where it forms a support at a level, where it sustains above it, and then gives the breakdown of the support. After giving the breakdown, the stock price approaches the broken level to retest that level and after retesting that level it continues its falls.
Recently, the same pattern has been followed by the price. It has given the breakdown of the level of $102.83 and has approached the $102.83 level to retest it. Currently, the price is sustaining above the gap which has not been filled yet.
The EMA lines are also sloping in the downward direction showing the sellers controlling the price. The price could rise to retest the 100 EMA line as it is currently far from 100 EMA. The RSI is currently facing resistance from its 50 level. It shows the price is struggling to go up.
The price seems weak in the current scenario. If the price moves up, it would be difficult for it to close above the $102.83 level. However, for the price to resume its downtrend in the current scenario. It must engulf the previous three candles by forming a strong bearish candle. Thus, it may fill the gap and can fall to its support at $85.00.
The price could only be seen in bullish sentiment if it closes above the 100 and 200 EMAs and reclaims the $102.83 level. Then only it may rise to its next resistance at $114.98.
Conclusion
The NKE chart shows the bearish sentiment over the price. There is a gap left which is yet to be filled and the price is currently trading above the gap zone. The price could be seen falling if it forms a bearish candle that engulfs the previous candle. Thus, it may resume its fall fill the gap, and reach its support at $85.00.
However, for the price to be in bullish sentiment it must close above the 100 and 200 EMA and reclaim the $102.83 level. Thus, only it may rise to its next resistance at $114.98.
Technical levels
Resistance Levels: $102.83 and $114.98.
Support Levels: $95.00.
Disclaimer
The views and opinions stated by the author or any other person named in this article are for informational purposes only. They do not provide financial, investment, or other advice. Investing in or trading comes with a risk of financial loss.




