Covenant x402
 Tetsuo Super Intelligence
 Doge Pepe
 Boomer
 Claudia
 hi
 Pearl

- The company’s share price has gained 16.67% in the last intraday session.
- Rubicon is planning to split the share price.
Rubicon Technologies Inc. (NYSE: RBT) is a leading software provider. It deals in the operation of a digital marketplace that provides a suite of software products for waste, recycling, and fleet operation products for business.
Rubicon Plans to Split Its Stock
Rubicon boards of members approved a 1 for 8 reserve stock split of the A common shares. The reason for the reverse split is to increase the stock per share price to meet the New York Stock Exchange’s continued listing requirements.
Rubicon Technologies Inc. (RBT) Stock Analysis
Rubicon Technologies’ share price after gaining 16.67% in the last trading session has traded at $2.17. RBT Technologies has a market capitalization worth 150.174 million USD.
RBT 1-Day Chart Analysis
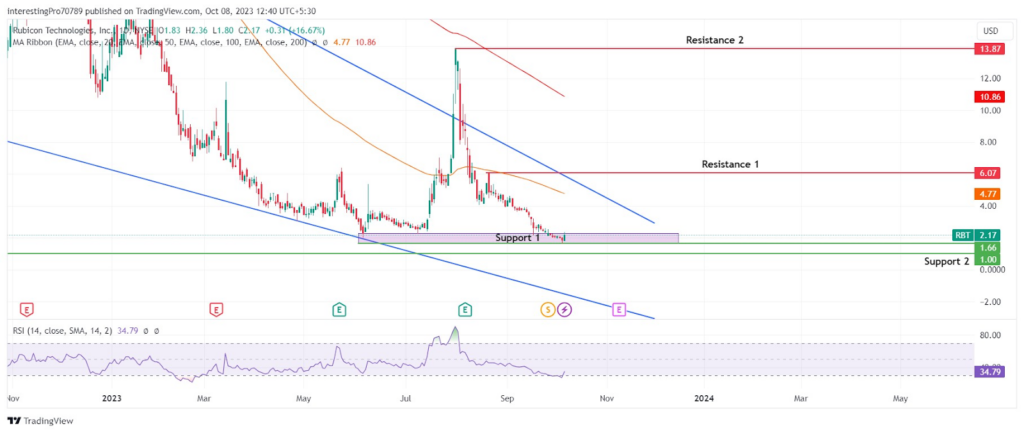
The RBT price can be seen trading inside a falling wedge pattern. In August 2023, the price tried to give the breakout of the falling wedge pattern, but it faced an immediate rejection. After that the stock price started to fall and fell back to its support at the $1.66 level.
In the last 43 trading sessions, the price has been in a continuous fall and has declined by 81.29%. Recently, it has taken support from the $1.66 support level and has gained 16.67%.
The 100 and 200 EMA lines are trading above the price showing the presence and control of sellers over the price. However, the price is trading a bit far from the EMA lines indicating that it can rise to test the EMA lines.
The relative strength index is at 34.79, which is marked in bearish territory. However, RSI has started to slop in the upward direction indicating the price may rise in upcoming trading sessions.
Currently, stock price has taken support from the $1.66 level and the indicators are also showing the price rise. If the price rise starts to move in the upward direction and gives the breakout of the falling wedge pattern and $6.07 level, it may reach its next resistance at $13.87.
The RBT share price is in a downtrend. To continue that downtrend it must close below the $1.66 support zone. After that, it may fall to its next possible support at $1.00.
Conclusion
The overall trend of the RBT price is bearish. It has been trading inside the falling wedge pattern since the end of last year. Currently, it has been taking support from the $1.66 support zone. The technical analysis shows that the price is currently taking support and to add on to that the indicators are also pointing towards the bull market.
Technical levels
Resistance Levels: $6.07 and $13.87.
Support Levels: $1.66 and $1.00.
Disclaimer
The views and opinions stated by the author or any other person named in this article are for informational purposes only. They do not provide financial, investment, or other advice. Investing or trading comes with a risk of financial loss.