
 Covenant x402
 hi
hi Pearl
Pearl Quantus
 Pudgy Penguins
 Boomer
 Lighter
- Shell and European oil companies’ share prices have increased after the outbreak of war in the Middle East.
- The price has been boosted by 7.49% since it has retested the 50 EMA and $62.70 level.
Shell Plc (NYSE: SHEL) is a global oil and gas company. The company specializes in the exploration and production of oil and natural gas.
Oil Sector to Gain with the Outbreak of War in the Middle East
The European oil companies’ share prices have increased since the outbreak of the War in the Middle East region. This has led to an increase in demand for crude oil, which is the reason for the boost European oil sector.
Shell Plc (SHEL) Price Analysis
The Shell stock price has gained 1.23% in its last intraday session, and is currently trading at $66.12. The overall market capitalization of the company is worth 208.723 Billion USD.
Bull Run on 1-Day Chart of SHEL
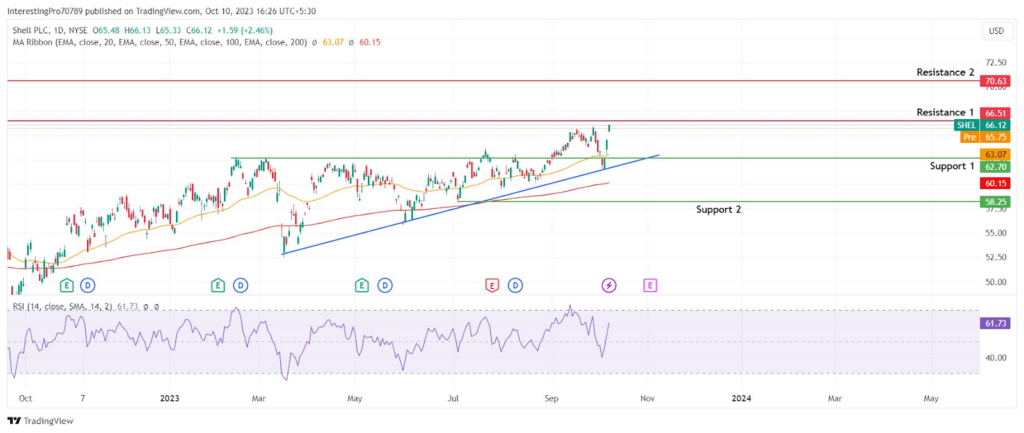
The SHEL share price has recently gained 7.49% after retesting its 62.70 level and trendline support. It is in a strong up move and reaching towards its $66.51 resistance.
The 50 and 200-day EMA lines are trading below the price, which is one of the bullish signs. The price has also taken support from the 500-day EMA and commenced a strong upmove. It shows the stronghold of buyers in the current scenario.
The relative strength index line is at 61.73, which is marked as bullish territory. The RSI line is trending in the upward direction. It shows the bull’s presence in the current scenario and has more space left in the upward direction to make the price rise.
The price is currently initiating a strong bullish and could give the breakout of the $66.51 resistance. If the SHEL stock price gives the breakout of the $66.51 resistance, it may rise to its next resistance at $70.63.
However, for the price to be in bearish sentiment it must give the breakdown of the $62.70 support. Thus, it may fall to its next support at $58.25.
Conclusion
The overall trend of the Shell share price is bullish. The price is currently commencing a strong upward move after retesting its $62.70 level and trendline support. If the share price gives the breakout of the $66.51 resistance, it may resume its uptrend to the $70.63 level. It can be a bearish sentiment if it gives the breakdown of the $66.51 support and both the EMA lines. Thus, it may fall to its next support at $58.25.
Technical levels
Resistance Levels: $66.51 and $70.63.
Support Levels: $62.70 and $58.25.
Disclaimer
The views and opinions stated by the author or any other person named in this article are for informational purposes only. They do not provide financial, investment, or other advice. Investing or trading comes with a risk of financial loss.




