
 Quack AI
 Lighter
 Pudgy Penguins
 Bittensor
 Solana
 Aptos
Aptos Quantus
- Tesla Inc. has sold more than 2 Million Model Y, which is a milestone for the company.
- The TSLA stock is following an uptrend and has advanced by more than 6% in the last 5 days.
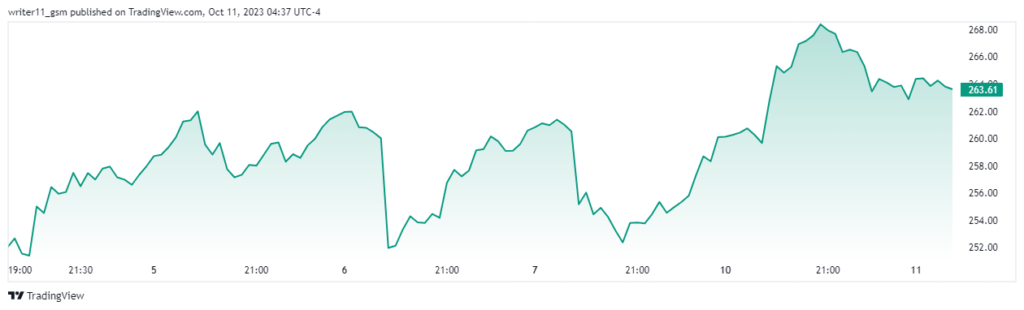
Tesla Inc. was founded in the US and its current CEO is Elon Musk. It is listed on the NASDAQ stock exchange with the TSLA ticker name. Tesla is world’s one of the largest EV automakers and a multinational automotive and clean energy company.
The company’s CEO, Elon Musk, is the largest shareholder of the company. He is holding 12% shares. The next biggest shareholder of the TSLA is Vanguard Group Inc. holding 7.01% of the shares of the company. The P/E ratio of the company is 73.67. It follows a debt/equity ratio of 4.56%, which is considered neutral for the company.
The Tesla Inc. has an EPS of 3.87 USD. The TSLA stock has 2.76B shares floating in the market for trading. This company’s market cap is $836.728B, which has advanced in recent times. The beta for the TSLA share is 2.1, making the returns on the stock more volatile than the market.
Tesla Inc. Stock Performance Analysis
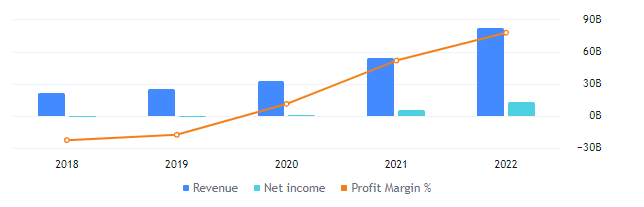
Tesla Inc. has made a very good profit in the year ending 2022. The revenue of the company has consistently advanced throughout the years following the same trend in the profit margin margin of the company. The debt for the company has also declined by $3.12B in the year ending 2022 as compared to the year 2021. Those details indicate how well the company has performed.
Performance Analysis of TSLA Stock
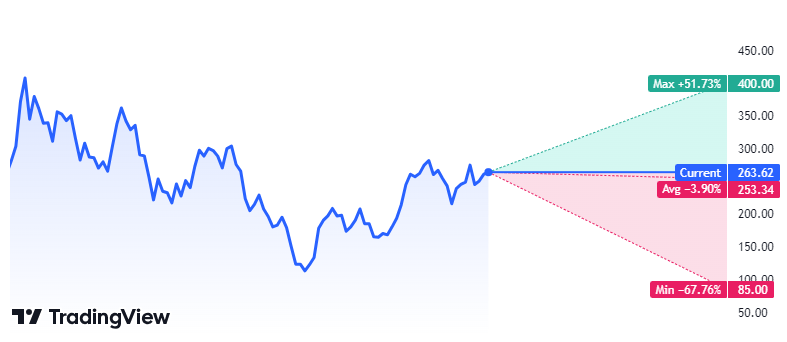
Analysts are aiming for a target of $400.00 which is 51.73% higher than the current CMP. Also, the highest drawdown expected for the TSLA stock price is $85.00 while the average price of the share is $253.34.
After Huge Sales In Tesla Cars, Can We See Huge Buying In Its Stock?
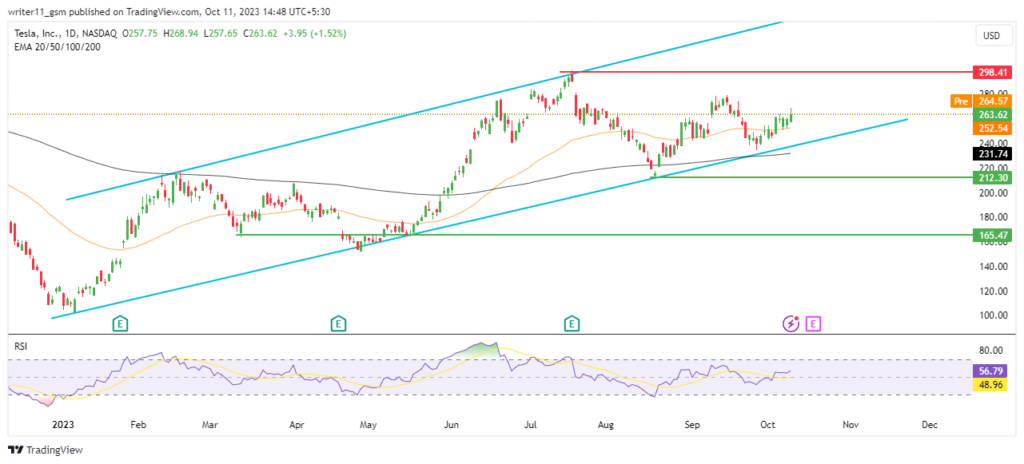
TSLA stock price is witnessing buying from the lower levels and the stock price consistently advanced for the last few days. The stock is trading inside a rising wedge pattern. It is taking rejection from the lower band of the pattern and is advancing to higher levels.
The 50-day and the 200-day EMA are trading in a bullish cross. The TSLA stock has also advanced above both the 50-day and the 200-day EMA. It indicates that the buyers are entering the stock.
Currently, the RSI on the TSLA stock charts is trading at a level of 56.79, advancing above the 14-day SMA line. The stock is currently trading above the 50-level showing indications for buying momentum.
Conclusion
Tesla Inc. has very good financials and it is one of the most popular EV car makers in the world. The techncials for the TSLA stock are bullish on the charts indicating a bullish market structure. Indicators like the EMA and the RSI are also giving a bullish signal.
Therefore, the share price of the TSLA stock can advance to higher levels in the upcoming days leading towards the upper band of the channel.
Technical Levels
- Support levels- $165.00 and $212.00
- Resistance levels- $298.00 and $263.00
Disclaimer
The information provided in this article, including the views and opinions expressed by the author or any individuals mentioned, is intended for informational purposes only. It is important to note that the article does not provide financial or investment advice. Investing or trading in cryptocurrency assets carries inherent risks and can result in financial loss.




