
 no crying in the casino
 IGNITION
 Hood Sword Inu
 streamoors
 Altai the Tiger
 Sword Inu
 Pearl
Pearl
- Morgan Stanley’s profit margin percentage decreased by over 7%.
- Morgan Stanley’s technical summary reveals a ‘sell’ signal.
- The company has a debt of more than $326 Billion and a FCF of $23.7 Billion.
Morgan Stanley (NYSE: MS) functions as a worldwide financial services corporation, offering a range of investment banking solutions and products to its clientele and the broader market.
The stock price of Morgan Stanley (MS) is currently following a downtrend. In the weekly timeframe, the stock is consistently reaching lower price levels, forming a pattern of lower lows.
MS stock is trading at $80.13, with an average volume of $6.5 Million shares. The net income of the company has declined by -12.4% per year and the ROI is also decreasing. Additionally, the stock has shown a decline of nearly 6% in the last six months. This declining return shows that the stock is underperforming, leaving a negative impact on the buyers.

Morgan Stanley has a huge debt of $329.3 Billion and a Free cash flow of $23 Billion. This shows that the company does not have enough cash to repay its debt. This can have a negative impact on the stock price.
Morgan Stanley’s stock reached its recent high of $109.7 in February 2022. Since then, the price has been in a persistent downtrend. Currently, the stock is forming a bearish pattern, reflecting a weak overall structure.
The price of MS is currently moving within a symmetrical triangle pattern. This pattern typically indicates an uncertain market situation but leans towards a bearish bias. Given the prevailing technical indicators, it’s likely that the stock price will continue to decline soon.
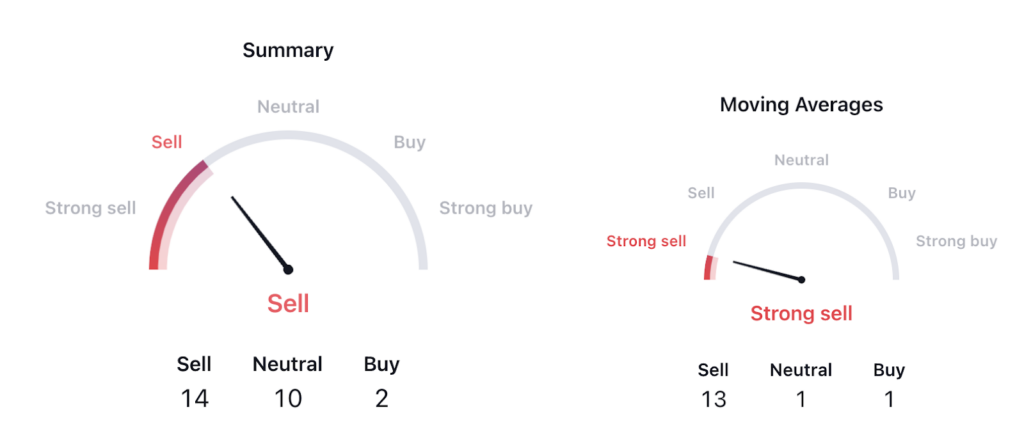
The technical summary also provides a ‘sell’ signal for the stock. Out of a total of 26 indicators, 14 are signalling a ‘sell’, while only one indicates a ‘buy’ signal. Additionally, the moving average summary indicators suggest a ‘strong sell’ for MS stock, further increasing the likelihood of a price decline.
Morgan Stanley (MS) Stock Price Analysis
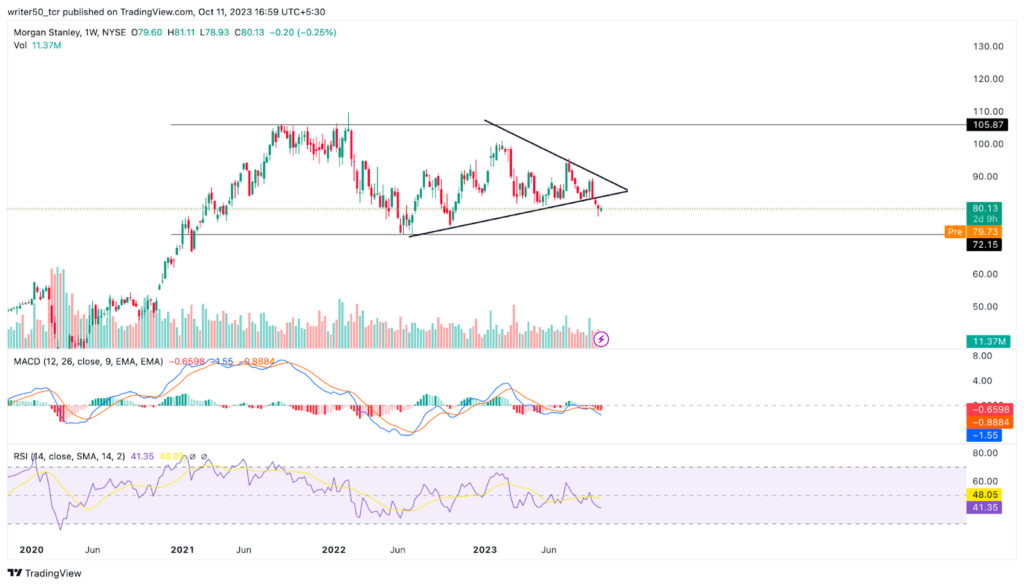
The MACD indicator for Morgan Stanley’s stock is displaying a scenario where the MACD line is positioned beneath the signal line. Additionally, a red histogram is forming. These indications collectively point towards a bearish trend for MS stock and suggest the possibility of price declines in the coming days.
Examining the RSI for MS stock, it is apparent that the RSI line is currently trading below the 14-period SMA line. Both of these lines are hovering near the 30 level, indicating a bearish sentiment. This weak RSI reading for MS stock implies the potential for future price drops.
Conclusion
As per the analysis, MS stock is currently moving in a downward direction. It’s currently showing downward momentum, with a 6% decrease over the last 6 months. The company’s debt is increasing, and it’s experiencing negative cash flow. The indicators are pointing towards a downward trend, suggesting that the MS stock price is likely to continue its decline in the coming days.
Technical Levels
- Support Level: $79.7
- Resistance Level: $94
Disclaimer
The views and opinions of the author, or anyone named in this article, are for informational purposes only. They do not offer financial, investment, or other advice. Investing or trading crypto assets involves the risk of financial loss.



