
 streamoors
 Injective
 Pudgy Penguins
 Celestia
 Pearl
Pearl Sui
Sui Bitcoin
- The VZ Stock has declined by more than 50% from its all-time high.
- Verizon Communications Inc. is about to announce its earnings and revenue.
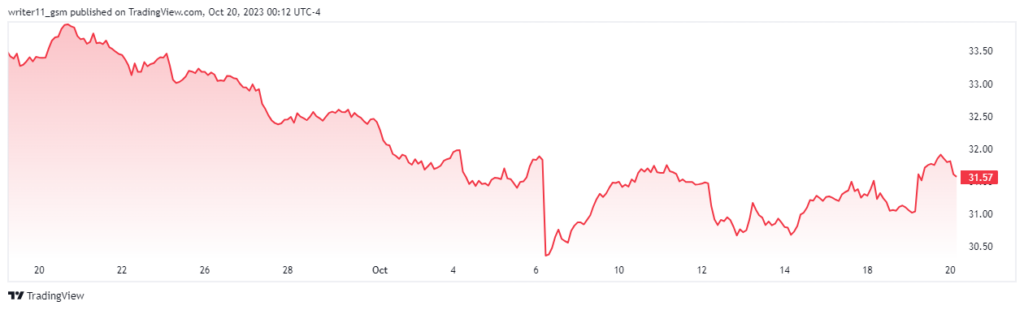
Verizon Communications Inc. is a multinational telecommunications conglomerate. Its current CEO is Hans Erik Vestberg and the company has its headquarters in New York. Verizon Communications was founded in the year 1983 and has more than 117K employees. The company was formerly known as Bell Atlantic.
Verizon Communications Inc. stands with very good financial ratios resulting in a price-to-book value of 1.40. This is followed up by the debt/equity ratio of 186.63% and the operating margin of the stock is 22.15%. While the ROA of the stock is neutral at 5.54%.
The average trading volume of the VZ stock is 22.16M and has 4.20B shares listed in the market. This results in a market cap of $132.764B and 1.371M shares are held closely by the investors which is 0.03% of the total shares.
The company makes its largest portion of revenue from the US and makes 75% of it from consumer services. VZ stock also pays dividends to its shareholders and has been consistently increasing its amount of dividend every year. The last payment for the dividend made by the company is $0.67.
Verizon Communications Inc. Stock Performance Analysis
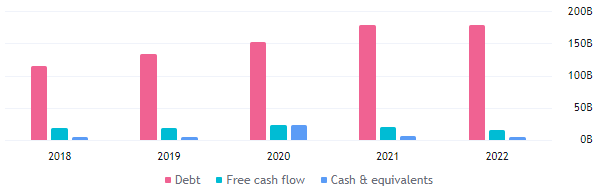
The debt for the company reported in the year ending 2022 is $176.33B resulting in a free cash flow of $14.05B. The revenue for Verizon Communications for the year 2022 is $136.84B. We can clearly see that the revenue of the company is almost similar to the debt reported. This is a not factor for the performance of the company. If Verizon Communications fails to advance its revenue or decline its debt, it might have to face consequences for that.
Analyst Rating For VZ Stock
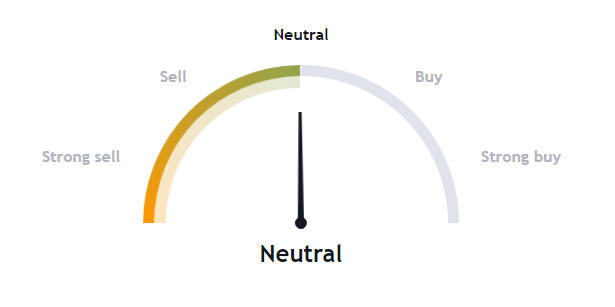
Based upon the experts of the Tradingview, the VZ stock price is neutral and might stay volatile in the upcoming days. This is because the stock has met the EPS expectations over various quarters but has been unable to meet the revenue expectations over the period and has underperformed in various quarters.
VZ Stock Is Still Folliwng Declining Channel Pattern
a by writer11_gsm on TradingView.com
The VZ stock has been consistently facing selling pressure since December 2020 and the price of the stock has declined by more than 45% since then. This decline in the price of the stock has led to a very strong downtrend in the stock.
The declining momentum in the VZ stock price is still following up as the share is trading inside a falling wedge pattern. It is also forming bearish candlesticks taking rejection from the higher levels.
With the consistent decline in price, the 50-day and the 200-day EMA are also trading in a death cross. This is followed by the value of the EMAs declining and the price of the stock also leading to lower levels.
The RSI for the VZ stock on the daily charts is trying to bounce back from the oversold zones and is currently trading at a level of 44.88. The RSI is following a bearish cycle and it again takes the rejection at 50 levels and declines to lower levels. The price of the stock can decline to further lower levels.
Conclusion
The revenue of the company is not good enough when compared with the reported debt of the company. The stock also has a low beta which makes it less volatile. The technicals of the stock are totally bearish indicating a sell signal. The price structure is also bearish making new lower lows.
Therefore, if the share price of the VZ stock breaks below the level of $30.00, it can decline to further lower levels. For an up move, the stock will need to push hard and break above the level of $35.00 and prevail above it.
Technical Levels
- Support levels- $25.00 and $30.00
- Resistance levels- $35.10 and $40.20
Disclaimer
The information provided in this article, including the views and opinions expressed by the author or any individuals mentioned, is intended for informational purposes only. It is important to note that the article does not provide financial or investment advice. Investing or trading in cryptocurrency assets carries inherent risks and can result in financial loss.



