
 Injective
 Pudgy Penguins
 Quantus
 Bitcoin
 Celestia
 Sui
Sui Derive
- The FOR stock price has made a new all-time high by breaking above the $26.53 level.
- Price is taking support from the 200-day EMA.
Forestar Group, Inc. (NYSE: FOR) is a residential lot development real estate company. It develops family houses on the sites and sells to local customers, regional peoples, and national builders. The company through ventures or directly, owns and manages properties and operates hotels and multifamily properties.
Past Performances of the FOR Stock
The FOR stock price has been in an uptrend since the last quarter of the previous year. Subsequently, it broke through the $15.87 which became the pivotal point for the potential change in trend. The stock has recovered almost 50% of its value this year.
In the third quarter, after the company reported its revenue, the FOR price gave a breakout of the previous high at $26.53. Consequently, it made an all-time high level at $31.43. It has generated total revenue of $368.90, which increased by 19.58%, as per the second quarterly report.
However, in the current quarter, the price has decreased to 13.92% while taking support from the $23.15 level. It might be gearing up for a bullish correction and positive pullback in favor of the investors.
The FOR stock has a yearly target of $32.00 and a yearly range of $31.42 and $10.28. The earnings-per-share (EPS) of the stock is at $2.91 along with the current P/E ratio at 7.97 while. The total market capitalization of FOR stock stands at $1,157,267,104 with an average volume of 120,540.
Technical Analysis and Price Prediction of the FOR Stock
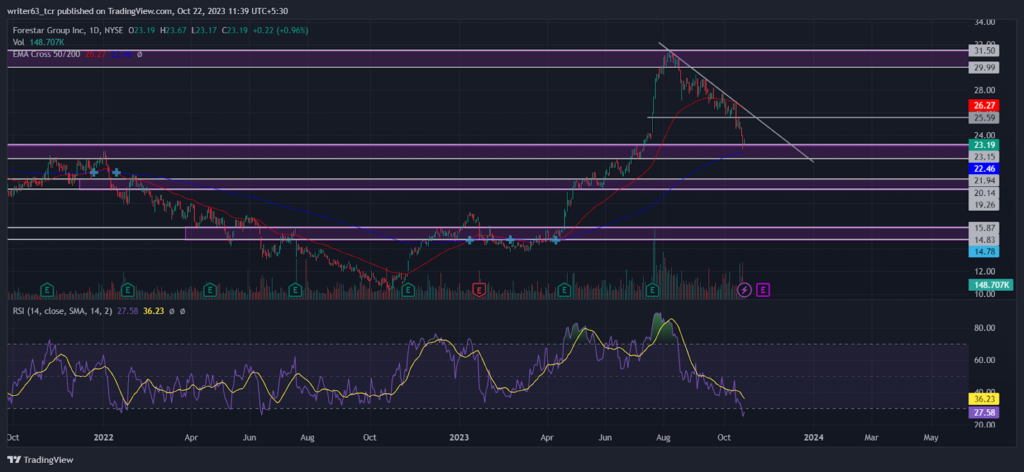
The FOR stock price has been in an uptrend since October 2022. Currently, the price is trading in between the 50-day EMA and the 200-day EMA reflecting a short-term fall in an uptrend. The 200-day EMA might become a bullish support for the price.
At press time, the price is trading at $23.19 at the support level of $23.15. As per the current movements, the price may make a bullish correction if it closes above the trendline or the $25.59 level. However, if the price faces successful resistance from the trendline, it may drop to the $20.14 level.
Furthermore, the relative strength index (RSI) is sloping at 27.58 below the 30-mark lower band. Currently, it is below its signal line in the oversold region in favor of sellers.
Conclusion
The FOR stock price has been in a bullish trend since October 2022. The price might be gearing up for the bullish correction at the $23.15 level. Therefore, the prediction for the stock will be bullish. At present, the price may make a bullish correction if it closes above the trendline or the $25.59 level. However, if the price closes below the $21.94 support level, it may drop to the $20.14 level.
Technical levels
- Resistance levels: $25.59 and $31.50
- Support levels: $21.94 and $19.26
Disclaimer
The views and opinions stated by the author, or any person named in this article, are for informational purposes only. They do not establish financial, investment, or any other advice. Investing in or trading stocks comes with the risk of financial loss.




