
 Minter
 Quack AI
 Pearl
Pearl Monero
 The Sandbox
 Pons
Pons Bittensor
- The BGB coin price is currently trading at $0.44725.
- The buyers have taken control of the price from the sellers.
BGB coin is a native token coin of the Bitget platform. It is an ERC20-backed coin that runs the Ethereum blockchain. The coin was launched to provide users with a variety of features, such as giving discounts on trading fees and providing early access to its newly launched projects.
Bitget (BGB) Coin Price Analysis
The BGB token gained 0.78% in the last 24 hours. It is currently trading at $0.44725 with a 24-hour volume of $13.607 Million. It has an average 1-day trading volume of $31.685 Million. Bitget has a circulating supply of 1,400,000,000 BGB coins and has a market capitalization of 623,922,220 USD.
BGB Coin Price Analysis in 1-Day Chart
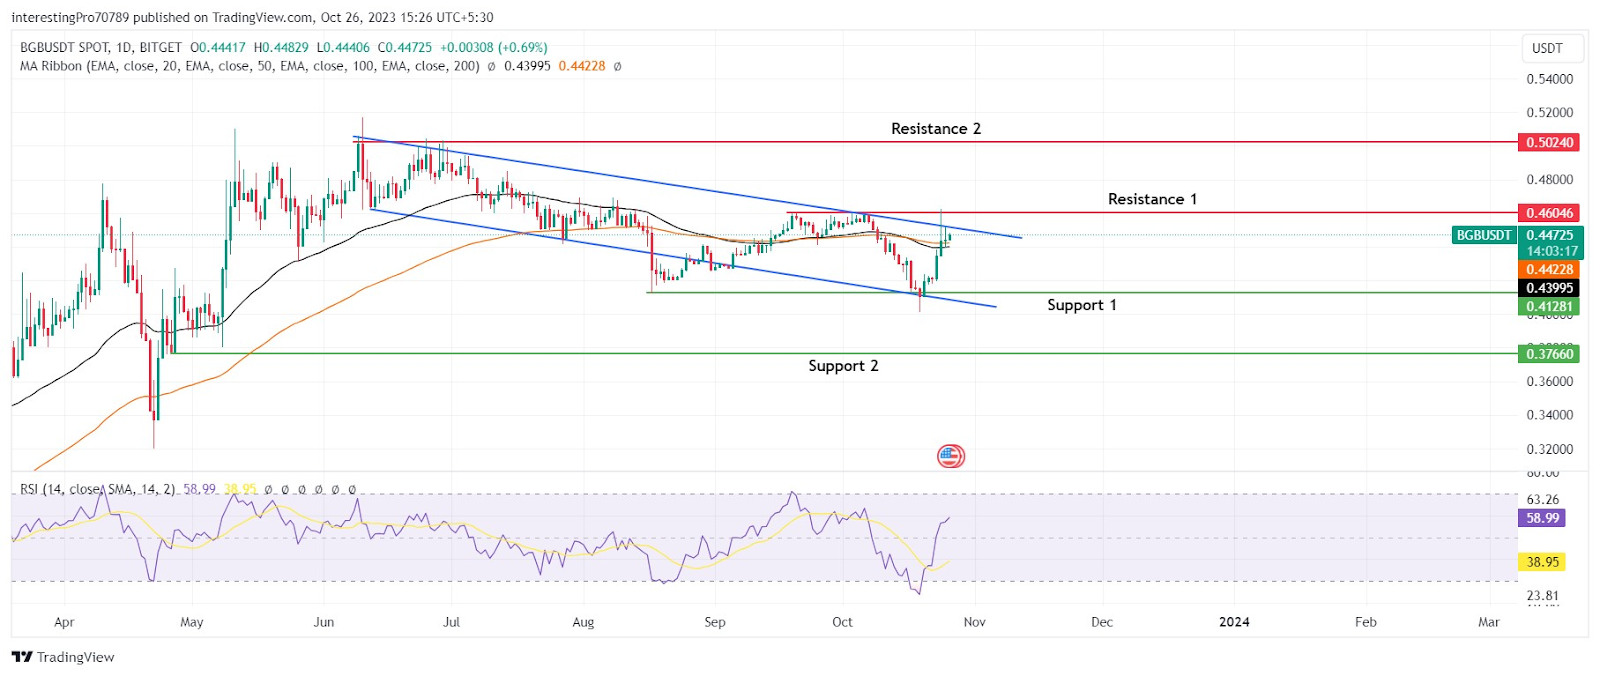
The wider outlook of the chart shows the BGB coin price seems to be trading in a falling channel. Since the past 8 trading days, the price has been in a continuous bull run, which was initiated from the $0.41281 support level. It has gained 9.05% since then and is currently reaching the upper trendline of the falling channel.
The price has reclaimed the 50-day and 100-day EMA lines and is trading above them. It shows the bulls have taken control of the price from the bears.
The relative strength index is at 58.95, which is the bullish territory. The RSI line is sloping in the upward direction, showing the high pressure that is applied by the bulls. Moreover, the space left in the upward direction shows the buying pressure may remain the same in the upcoming trading sessions.
In the current scenario, the price is initiating a bull run. If it gives the breakout of the falling channel, it will have to face the immediate resistance at $0.46046. However, if it manages to close the price above the $0.46046 resistance level, it may rise to its next resistance at $0.50240.
Suppose the price faces rejection from $0.46046 or the upper trendline of the falling channel, it may fall to its support at $0.41281. For the continuation of the downtrend, it must give the breakdown of the $0.41281 support. After that, it may continue its fall to its next support at $0.37660.
Conclusion
The BGB coin is currently initiating a bullish run. It has reclaimed the 50-day and 100-day EMA lines. The technical indicators are showing bullishness in the price. However, for the continuation of the bull trend, it must give the breakout of the upper trendline of the falling channel and $0.46046 resistance. After that, it may continue its further rise.
Technical levels
Resistance Levels: $0.46046 and $0.50240.
Support Levels: $0.41281 and $0.37660.
Disclaimer
The views and opinions stated by the author or any other person named in this article are for informational purposes only. They do not provide financial, investment, or other advice. Investing or trading in crypto comes with a risk of financial loss.




