
 Covenant x402
 hi
hi Pearl
Pearl Quantus
 Pudgy Penguins
 Boomer
 Lighter
- The stock price is currently trading at $19.39.
- The ENPH company has reported its Q3 results which led to a decline in its share price.
Enphase Energy (NASDAQ: ENPH) is an energy technology company that deals in the manufacturing and sales of home energy solution products. Their products include Solar micro-inverters, Battery energy storage, EV charging stations, Energy generation, and Energy storage. It is a small-cap business with a market capitalization of 11.193 USD.
Why is Enphase Share Price Falling?
On 26 October 2023, Enphase reported its Q3 earnings report which showed poor financial growth. The estimated revenue for the Q3 result did not meet expectations and declined by 13.81%. The earnings per share (EPS) was also not as expected as it declined to 1.02 compared to its previous Q2 report which was 1.47. The overall financial statement declined which led the ENPH share price to fall in its next trading session.
Enphase Energy Inc. (ENPH) Stock Analysis
In the last trading session, the ENPH price opened up with a gap down at $19.39 with a decline of 12.86%. It closed its intraday session at $82.09 with a decline of 0.09%. It traded with a volume of 19.391 Million.
Is the ENPH 1-Day Chart Showing Recovery in Price?
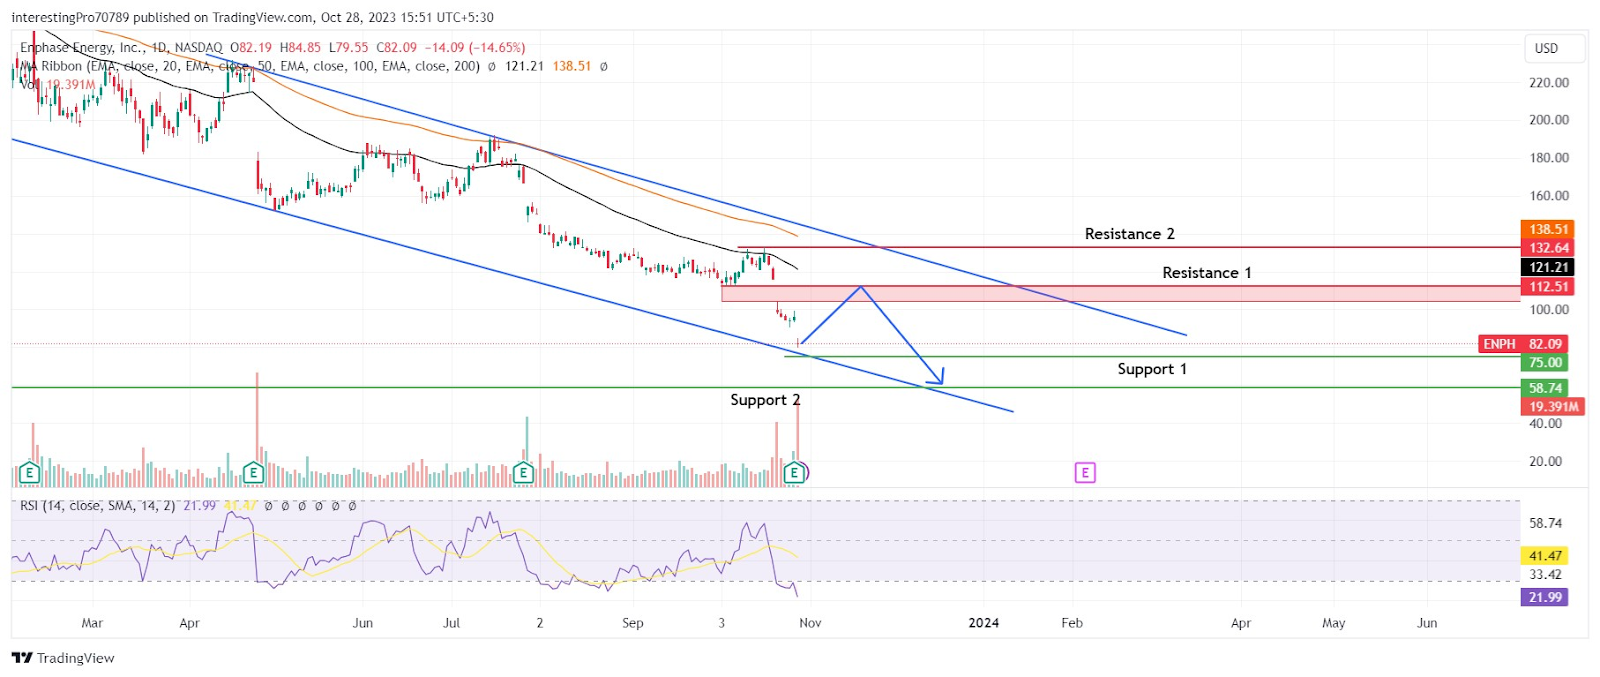
While analyzing the 1-day chart of ENPH, it shows that the price is trading in a falling channel. In the recent scenario, the share price has been falling and has left several gaps in the upward direction that need to be filled.
The 50-day and 100-day EMA is above the price which is a bearish sign. However, the EMA lines are far from the price which shows the price can head toward the EMA lines to retest them.
The Relative Strength Index is at 21.99 which is the over-sold territory. This shows the price is facing high-selling pressure which can lead to a pullback in the near future.
The volume bar spiked up and traded with a volume of 19.931 Million in the last intraday session. This shows the strong seller influence and indicates that a strong price movement has been done.
In the current scenario, the price can rise from here in the upcoming trading session as the technical indicators are showing. So we can expect a rise in price in the future where it can rise and retest the $112.51 resistance level and EMA line. This will also fill the gaps above which have been left by it while falling. For buyers to to take control of the price firstly they should reclaim the $112.51 level and the EMA lines. Secondly, they should sustain the price above it for a stronger base formation. After which the price may rise to its next resistance at $132.64.
However, the overall sentiment is bearish which suggests the price can resume its downtrend after it has retested the EMA lines and the $112.51 resistance zone. As long as the price is below the EMA lines there is a higher chance of the continuation of the downtrend which will lead the price to fall to the $75.00 support level. If the price breaks this level then it will continue its fall to its next support at $58.78.
Conclusion
The overall sentiment of the EPNH price is bearish. However, the technical indicators are pointing towards the price rise. So we can expect a rise in price in the upcoming trading session which will lead the price to retest the EMA lines and $112.51 level. According to the overall sentiment as long as the price is sustaining below the EMA lines it can continue its downtrend from there.
Technical levels
Resistance Levels: $112.51 and $132.64.
Support Levels: $75.00 and $58.78.
Disclaimer
The views and opinions stated by the author or any other person named in this article are for informational purposes only. They do not provide financial, investment, or other advice. Investing or trading in crypto comes with a risk of financial loss.




