
 Dacity Coin
 streamoors
 astronaut
 Injective
 Celestia
 Pudgy Penguins
 Sui
Sui
- The Tantech Holding stock price has jumped by over 6% in the previous trading session.
- The Tantech holding stock price is moving inside the falling wedge pattern on the daily chart.
- The TANH stock price has surged by over 210% from the yearly low level.
Since its listing, the Tantech Holding (NYSE: TANH) stock price has been in a downtrend and it is still continuing down this trajectory. However, it has witnessed some wild swings in its journey so far. The price reached an all-time high level of $7461.60 on 31 August 2015. The current market price of TANH stock is $2.90.
TANH stock showed a jump of over 117% on 1 May 2023. This is a massive jump for a listed stock on the NYSE. Apart from this massive jump, the stock price has been moving in a sideways trend since October last year. Such a move is not suitable for intraday traders as it can increase the losses multiple times. The TANH stock price created an all-time low level of $0.83 on 4 October 2023. It witnessed one more wild swing in October, as the stock price surged by over 155% in a single day. However, the stock price saw profit booking on the same day and formed a strong bearish pattern.
Have a Closer Look at the TANH Stock Chart
TANH stock price has formed a falling wedge pattern on the daily chart which is considered a bullish pattern. The breakout from this level can change the bearish trend of the stock. A wild swing is also possible ahead as the stock price is very volatile. It is suffering from a liquidity issue as the total volume of the stock is about 1,30,000, which is low for such a penny stock.
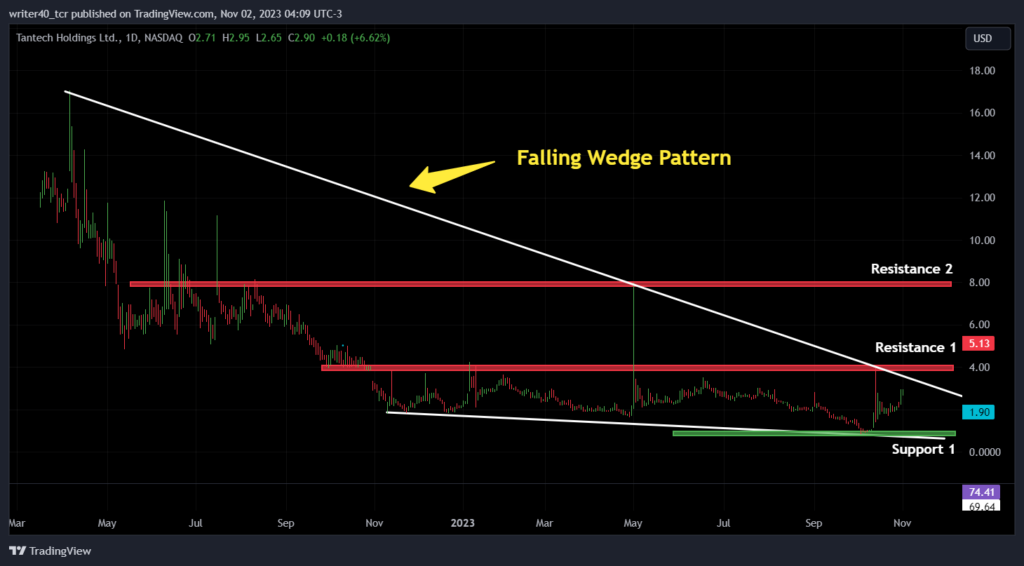
The TANH stock price has faced strong resistance from the trendline drawn on the chart above. It is inching closer to the trendline again and the trendline resistance is present near the level of $3.60. Apart from this, the horizontal resistance is present near the levels of $4.14 and $8.11. The stock price has taken support near the level of $0.83.
What the EMA and RSI are Indicating About the Stock Price.
The TANH stock price is situated above the 50-day exponential moving average (EMA) which is a positive sign for the stock in a shorter time period. However, the coin price is inching closer to the 200-day EMA, which is present near the level of $5.13.
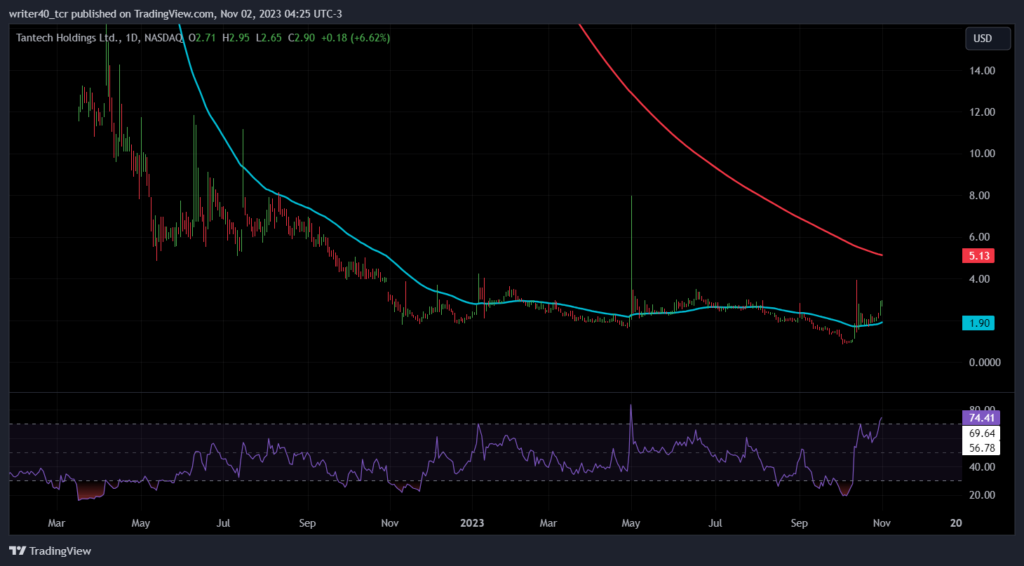
The relative strength index (RSI) is curving at 74.41, which indicates that the stock price is currently in an overbought trajectory. However, if we notice the slope of the RSI it has reached the overbought trajectory again in a short period. This indicates that the bulls are super strong.
Conclusion
The stock price has gained strong momentum from the lower side and it is looking strong. The price can continue the uptrend and try to challenge the sellers present near the 200-day EMA.
Technical Level
- Resistance – $4.14 and $8.11
- Support – $0.83
Disclaimer
The views and opinions stated by the author, or any people named in this article, are for informational purposes only. They do not establish financial, investment, or other advice. Investing in or trading crypto assets comes with a risk of financial loss.



