
 Covenant x402
 hi
hi Pearl
Pearl Pons
Pons Claudia
 Bitcoin
 Injective
- FUBO stock is showing potential to advance to higher levels.
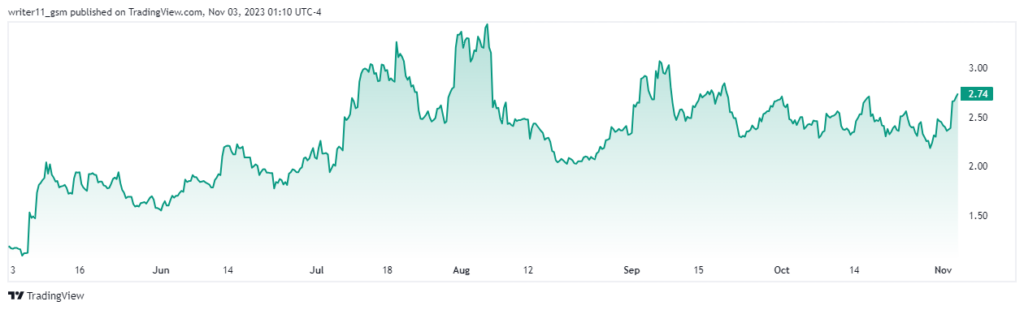
- In the last six months, the FuboTV Inc. share has advanced by 100%.
FuboTV Inc. is a streaming television service provider in the United States, Canada, and Spain. The company was founded in the year 2009 and has 510 employees working for it. The current CEO of the company is David Gandler and has its headquarters in New York.
The FUBO stock has 281.068M shares floating in the market and 3.94% of the shares are closely held. The major part of the revenue of the company comes from subscriptions with 89.81% and the rest 10.09% of the revenue comes from advertisements.
The stock also broke its volume record of the last three months’ average of 14.037M resulting in a traded volume of 20.812M in the last trading session. The gross margin of the company is negative to -1.20% following a market cap of $801.681M.
The current debt/equity ratio of the FUBO stock price is 108.89% which is a good sign for the company. This results in a reported debt of $442.80M. However, the ROI of the company is highly disappointing resulting in -70.36%.
Has FUBO Stock Reversed And Is Going For An Uptrend?
After hitting an all-time high price of $22500.00, the stock price started to decline hitting an all-time low of 0.3180. It is a decline of more than 99% in the stock price.
The share price is currently witnessing buying pressure and has broken out above the triangle pattern with higher momentum. This represents that the buyers are trying to dominate the stock price.
Due to the existing downtrend, the FUBO stock was trading following a death cross of the 50-day and the 200-day EMA. However, the stock has broken out above both the EMAs.
After being consolidating in a small range for a long time, the RSI for the stock has broken out above the volatile range leading to an advance above the 50-level.
Conclusion
The financials of the company are not very reliable as the profit margin of the company is negative. Also, the technicals for the stock price are bullish on the charts as the stock price has broken out above the triangle pattern.
Technical Levels
- Support levels- $1.00 and $1.90
- Resistance levels- $3.80 and $4.60
Disclaimer
The information provided in this article, including the views and opinions expressed by the author or any individuals mentioned, is intended for informational purposes only. It is important to note that the article does not provide financial or investment advice. Investing or trading in cryptocurrency assets carries inherent risks and can result in financial loss.




