
 Pearl
Pearl Ondo
Ondo Starknet
 Quantus
 Aerodrome Finance
 Pudgy Penguins
 Akash Network
- The DGB coin price gave a breakout from the trendline forming below.
- The price gave a return of 13.75%, during the monthly trading session.
DigiByte (DGB) is an open-source longstanding blockchain and cryptocurrency. It works as an asset-creation platform that uses five different algorithms to improve security, the Bitcoin blockchain’s security, capacity, and transaction speed. Digibyte runs voluntarily and the miners are paid transaction fees in DGB for validating the block creation.
Performance of the DGB Token
In November 2022, the DGB coin price made a bullish rally which lasted to the $0.013540 resistance level. That shows crypto investors’ sentiments for the coming years. The price recovered 119% of its value during this bull run.
During that bullish rally, the price created immediate support at $0.009450, lately broken by the selling pressure from the $0.013540 resistance level. Subsequently, the $0.009450 support level became a pivotal level for the future price decline.
The DGB coin price fell more than 35% after the breakdown of that support level. On the other side, the 50-day and the 200-day EMAs also became minor and major resistance levels to the coin price.
The DGB coin price fell multiple times on the same support level at $0.006022. Consequently, that level became a strong support for preventing the price from falling further. At present, the market value of all the DGB coins is $199,165,280.
Technical Analysis of the DGB Coin
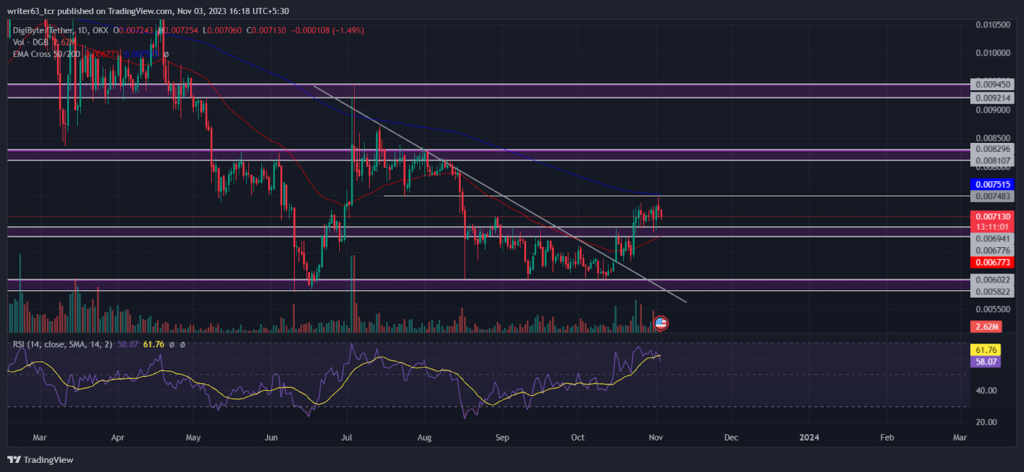
The DGB coin price is facing consistent resistance from the 200-day EMA, reflecting the sellers’ presence at that level. The price is in the short-term rising after it broke above the 50-day EMA. At present, the 50-day EMA is at $0.006775 and the 200-day EMA is at $0.007515.
In the wider outlook of the chart, the DGB coin price has given a breakout at $0.006356 from the descending triangle-like pattern. It recently broke above the $0.006941 resistance level and is facing resistance from the $0.0074 rejection level. In the last three trading sessions, it formed a bullish candle at $0.006941. It signifies the buyers’ active positions on that level.
The relative strength index (RSI) is showing a little bearish divergence in the price momentum. That indicates the sellers may arrive to increase selling pressure at that level. At present, the RSI is sloping at 59.41 slightly below the signal line.
Conclusion
The DGB coin price has been moving in a downtrend since the end of February 2023. It recently gave a breakout from the descending triangle-like pattern, which caused the break of the 50-day EMA and led coin price rise. The DGB coin price is moving toward the $0.009450 resistance level. In addition, if the price closes above that level, it may rise to the $0.013540 major resistance level.
Technical Levels
- Resistance levels: $0.007483 and $0.008296
- Support levels: $0.006776 and $0.005822
Disclaimer
The views and opinions stated by the author, or any people named in this article, are for informational purposes only. They do not establish financial, investment, or any other advice. Investing in or trading crypto assets comes with the risk of financial loss.




