
 Dacity Coin
 Pearl
Pearl Bitcoin
 Injective
 Pudgy Penguins
 Quantus
 Starknet
- Chevron Corporation’s actual earnings are less than 17% in comparison to the expected earnings.
- Chevron Corporation (CVX) stock gave a return of -21% last year.
- Chevron Corporation’s gross profit has declined by -37% YoY.
Chevron Corp. provides administrative, financial management, and technology support services for energy and chemical operations.
Technical Analysis of CVX Stock
The CVX stock price is currently experiencing a downward trend, characterized by a series of lower lows and a recent breakdown from a triangle pattern. The gross profit for CVX stock in Q3 2023 is $9.19 Billion, reflecting a decline of -37% YoY.
The return on assets for the company has also decreased by approximately 28.9% YoY, displaying a negative aspect for the stock. Actual earnings of the company are below expected earnings, with a 1.7% decline from $235 Billion in 2022 to $238 Billion in 2023. This indicates a weakened financial condition within the company.
The stock has consistently moved in a downward direction, posting a negative return of 21.6% in the previous year. This poor performance may discourage investors’ interest in establishing new positions.
While the company maintains a consistent dividend payout to shareholders, the payout has decreased over the years. In 2023, the dividend was 6.11% compared to 3.16% in 2022. This could be perceived negatively by investors seeking a stable source of passive income.
CVX peaked at $189.68 in November 2022 but has since experienced a decline of nearly 20% by March 2023, finding support at $151.32. The recent breakdown from a triangle pattern indicates a negative outlook, suggesting a potential for further price decline.
Chevron Corporation (CVX) Stock Price Analysis
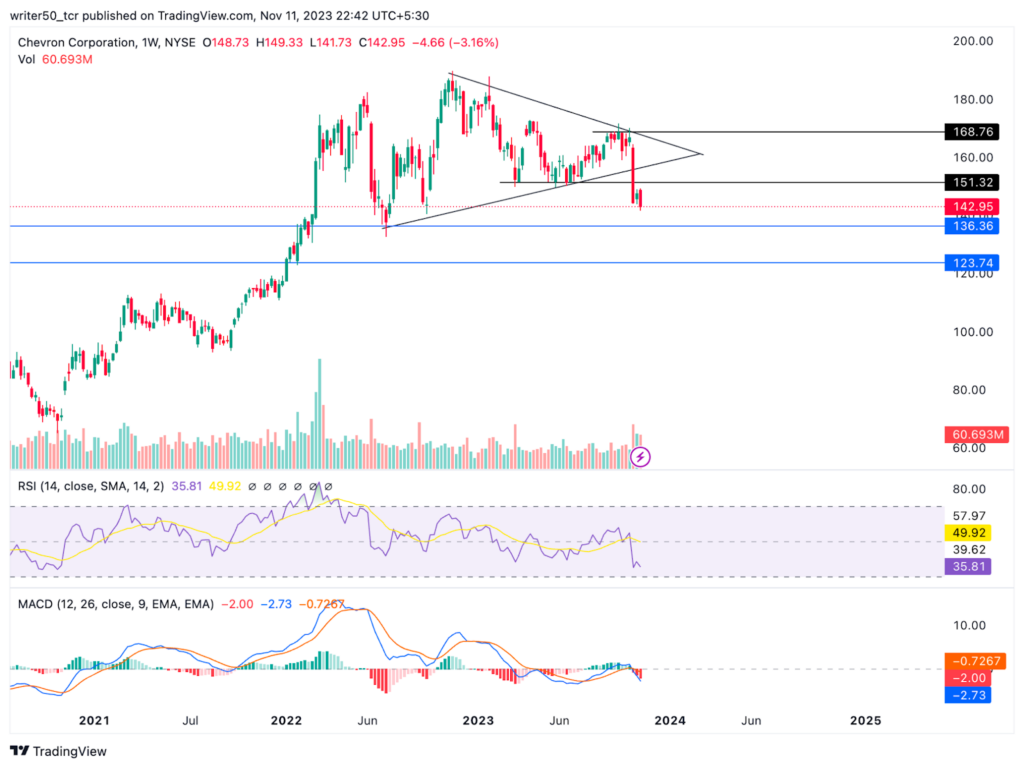
Additionally, both the MACD and signal lines are currently positioned below the zero line, leading to a red histogram on the MACD indicator. This arrangement suggests the potential for an imminent market downturn in the days ahead.
Furthermore, the RSI line for Chevron Corporation is at 35, below the SMA line positioned at 49. This particular configuration is commonly associated with a bearish sentiment, indicating a potential decrease in the stock price shortly.
Conclusion
The stock of Chevron Corporation is indicating a downtrend, marked by a negative return in the preceding year. After facing resistance, the price has reversed its direction, and the indicators are aligning with a bearish perspective for the stock price. Additionally, the technical indicators are giving weak signals, suggesting an expected decrease in the price in the upcoming days.
Technical Levels
- Support Levels: $136.36 and $123.7
- Resistance Levels: $151.32 and $68.7
Disclaimer
The views and opinions of the author, or anyone named in this article, are for informational purposes only. They do not offer financial, investment, or other advice. Investing or trading crypto assets involves the risk of financial loss.




