
 Pearl
Pearl Ondo
Ondo Starknet
 Quantus
 Aerodrome Finance
 Pudgy Penguins
 Akash Network
- Fathom Digital Manufacturing Corporation’s stock price has surged by over 107% in a week.
- It has formed a falling wedge pattern on the daily chart.
- The company is going to release its earnings on 14 November 2023.
In the previous trading session, the Fathom Digital Manufacturing Corporation stock price surged by over 46% in an intraday session. However, as the day progressed the stock price saw some profit booking from the upper levels and closed the day with a surge of 17%. The stock price has formed a shooting star pattern on the daily time frame.
Soon after the listing, the Fathom Digital Manufacturing Corporation stock price showed a sideways move for more than 9 months and it was trading in a range. After January 2022, the stock price has shown some high volatile moves and it has started to decline. The stock has shown a great decline of over 96% from the all-time high level of $230.
The company is going to release its earnings report on 14 November 2023. The stock price had already anticipated the news and surged heavily after that. It has surged for the sixth consecutive season, which indicates that the Bulls have created a strong position at the lower level and are expecting some turnaround from here.
Will the FATH Stock Price Reach $10?
The FATH Stock price has formed a falling wedge pattern on the daily time frame and it has recently faced a strong resistance from the upper trendline of that pattern. The stock price has respected both the upper and lower trendlines, which indicates that this level will play a crucial role in the future movement of the price.
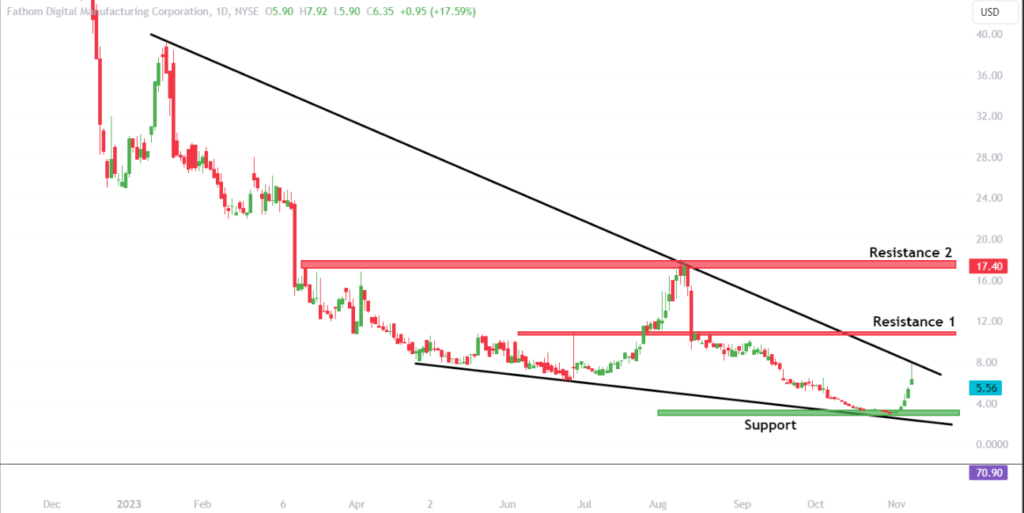
The price will face resistance from the upper trendline of the pattern, which is present at the level of $8. Apart from this, the other resistances are present at the level of $10.90 and $17.50. The lower trendline will provide support to the price and it is present at the level of $2.28. The horizontal support for the price is present at the level of $2.90.
What Do the EMA and RSI Indicate About the FATH Stock?
In the previous trading session, the FATH stock price successfully reclaimed the 50-day Exponential Moving Average (EMA). It can be the first sign of the reversal as the stock price is looking super strong. The 200-day EMA is present at $17.40.
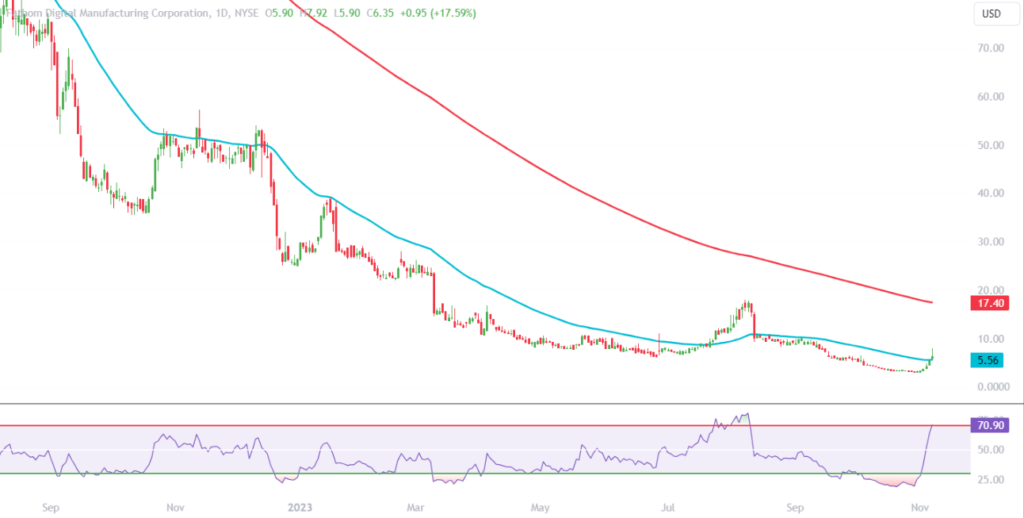
The Relative Strength Index (RSI) is curving at 70.90. It indicates that the stock price is currently being overbought. It needs some correction to resume the uptrend, as the slope of the RSI is sharply upward.
Conclusion
The FATH Stock price has surged strongly and it seems like the buyers have created some long positions in the stock. The future movement will be decided on the earnings report.
Technical level
Resistance – $10.90 and $17.50
Support – $2.90
Disclaimer
The views and opinions stated by the author, or any people named in this article, are for informational purposes only. They do not establish financial, investment, or other advice. Investing in or trading crypto assets comes with a risk of financial loss.




